Although the current administration’s immigration policy in the United States has focused on the search and deportation of thousands of immigrants, flights designated for this task show that during the new administration’s first six months, ICE has moved more immigrants between states than have left for their countries of origin or other nations.
A few days ago, U.S. Secretary of Homeland Security Kristi Noem stated on social media that, “The world has heard our message: In less than 200 days, 1.6 million undocumented immigrants have left the country. With President Trump, we now have safer streets, better jobs for Americans, and less pressure on schools, hospitals, and social services.”
This statement was based on a report from the Center for Immigration Studies (CIS), which was prepared using data provided by immigrants to Current Population Survey pollsters. However, this study shows a disappearance of 2.2 million migrants from the statistics between January (when Trump returned to the White House) and July, and admits that this may not be because these people actually left the country, but because more immigrants did not respond to the federal survey or did not identify themselves as foreigners.
And it is precisely this last theory that seems to support a study that I learned about from the Organization Witness at the Border , which shows that the current administration would not be deporting large numbers of immigrants, at least by air.
Since Trump returned to the White House, according to this study, ICE has carried out a total of 5,756 flights , of which only 992 have been for the removal or expulsion of immigrants, while 3,377 random flights have occurred within the United States, where people in ICE custody are reportedly being transferred, which could involve moving from one detention center to another.
How far are deportation figures from the government’s goals?
Consider that the maximum capacity of standard charter flights used for this purpose averages 130 passengers, the result would be 128,960 immigrants deported from the United States by air from February to July by this administration on 992 flights.
On the other hand, we have the approximate number of immigrants being transferred internally between some states. We’re talking about a total of 439,010 immigrants transported on 3,377 flights during the same period of the Trump administration.
According to Tricia McLaughlin, a spokeswoman for the Department of Homeland Security, U.S. Immigration and Customs Enforcement (ICE) has deported approximately 150,000 people since President Donald Trump took office.
What this tells us is that President Donald Trump will hardly be able to fulfill his campaign promise of deporting 1 million immigrants a year as he had proposed, because if the current pace continues, the figure he could reach would be around 260,000 deportations, at least by air.
Trump maintains the same flight trend as Biden: more movements than expulsions.
During the Biden administration, from February 2021 to January 2025, ICE conducted a total of 30,060 flights. Of these, 5,539 were for removal or deportation, or just 18%.
Although in half a year the Trump administration has already made 19% of the flights (5,756) of Biden’s 4 years and could register a historic record during his administration, surpassing 46 thousand flights, the behavior and its purpose is not very different from that of his predecessor, since the greater number of flights would be used to move many immigrants between states and not to deport them from the United States.
The figures show that from February 2021 to January 2022, during the Biden administration, ICE authorized 6,382 flights in total, of which 1,080 were for removal (17%), another 3,872 (60%) were to move immigrants within the United States, and the remainder were related to deportation.
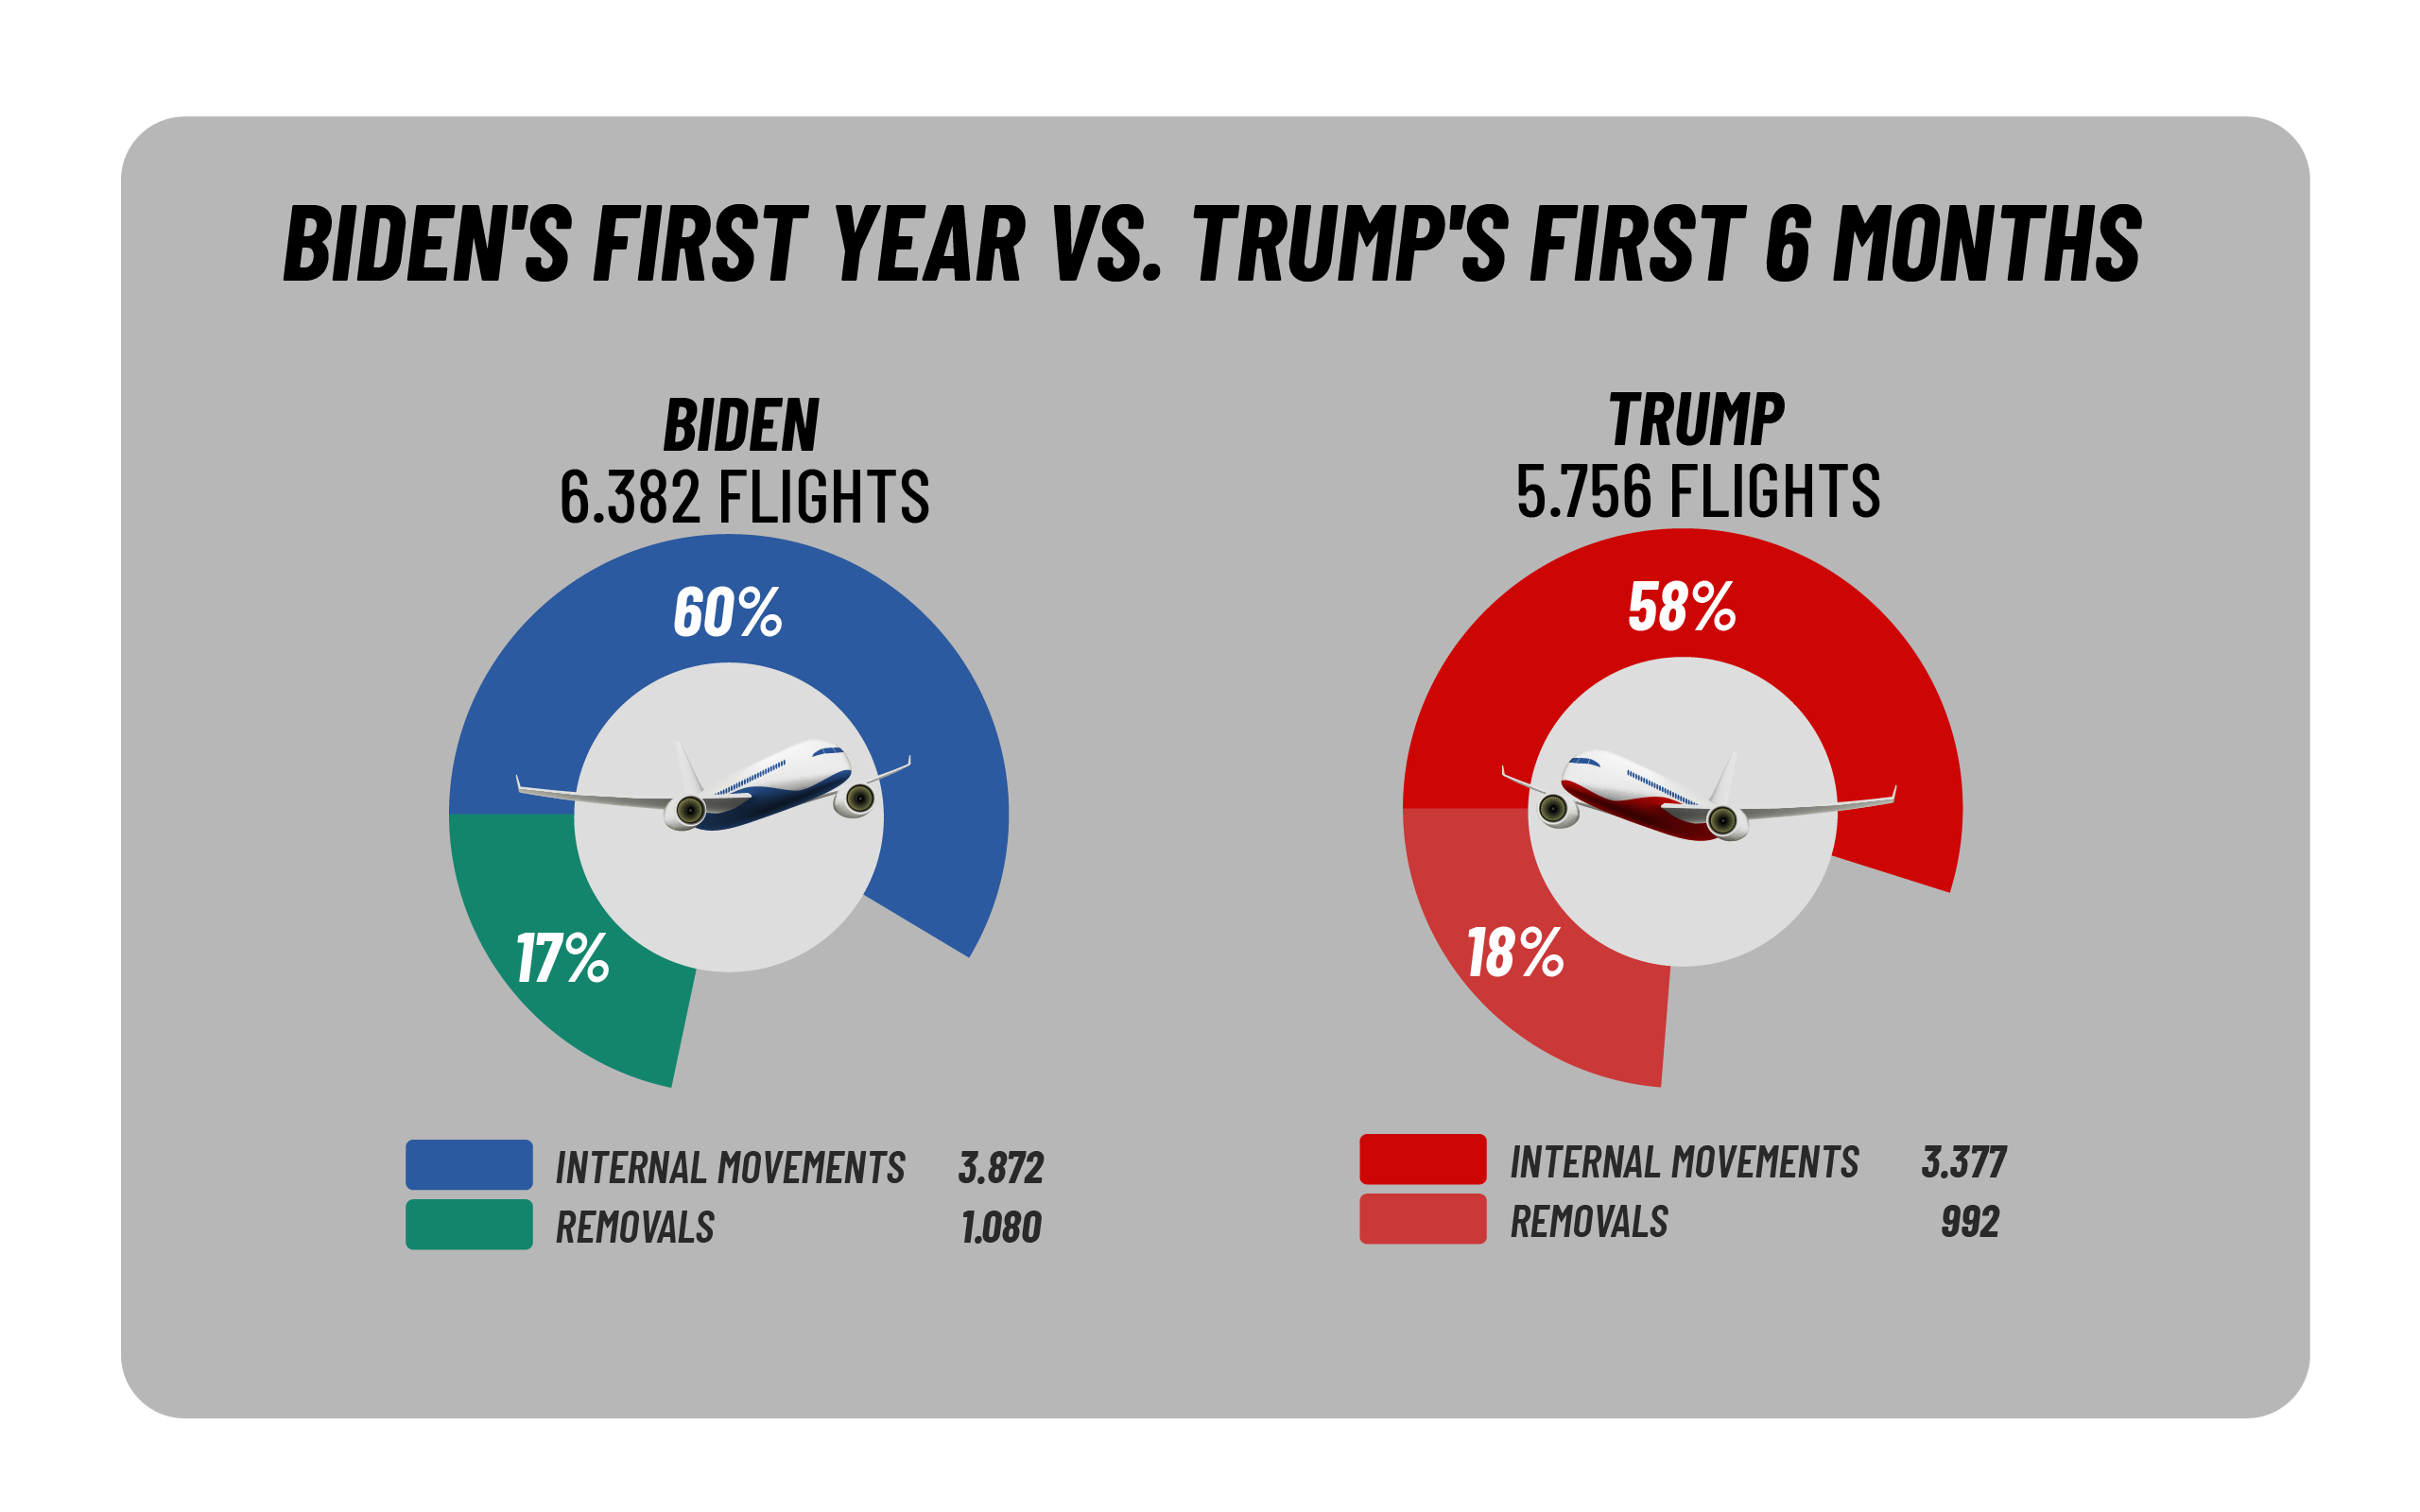
As I had already explained, during 2025 ICE has already accumulated 5,756 flights in total between February and July , of these 992 have been for removal or deportation , that is, 18%, 3,377 are random flights for the transfer of immigrants (58%) and another 1,387 (24%) related to removal.
Biden’s first year
First 6 months of Trump 2.0
When looking at the behavior of flights executed by ICE in the last six months of the Trump administration, compared to the first six months of Biden’s administration, we find that the total number remained almost similar. However, the Trump administration, during this period, conducted more deportation flights than in Biden’s first six months, when random internal flights increased more than fivefold compared to removal flights.
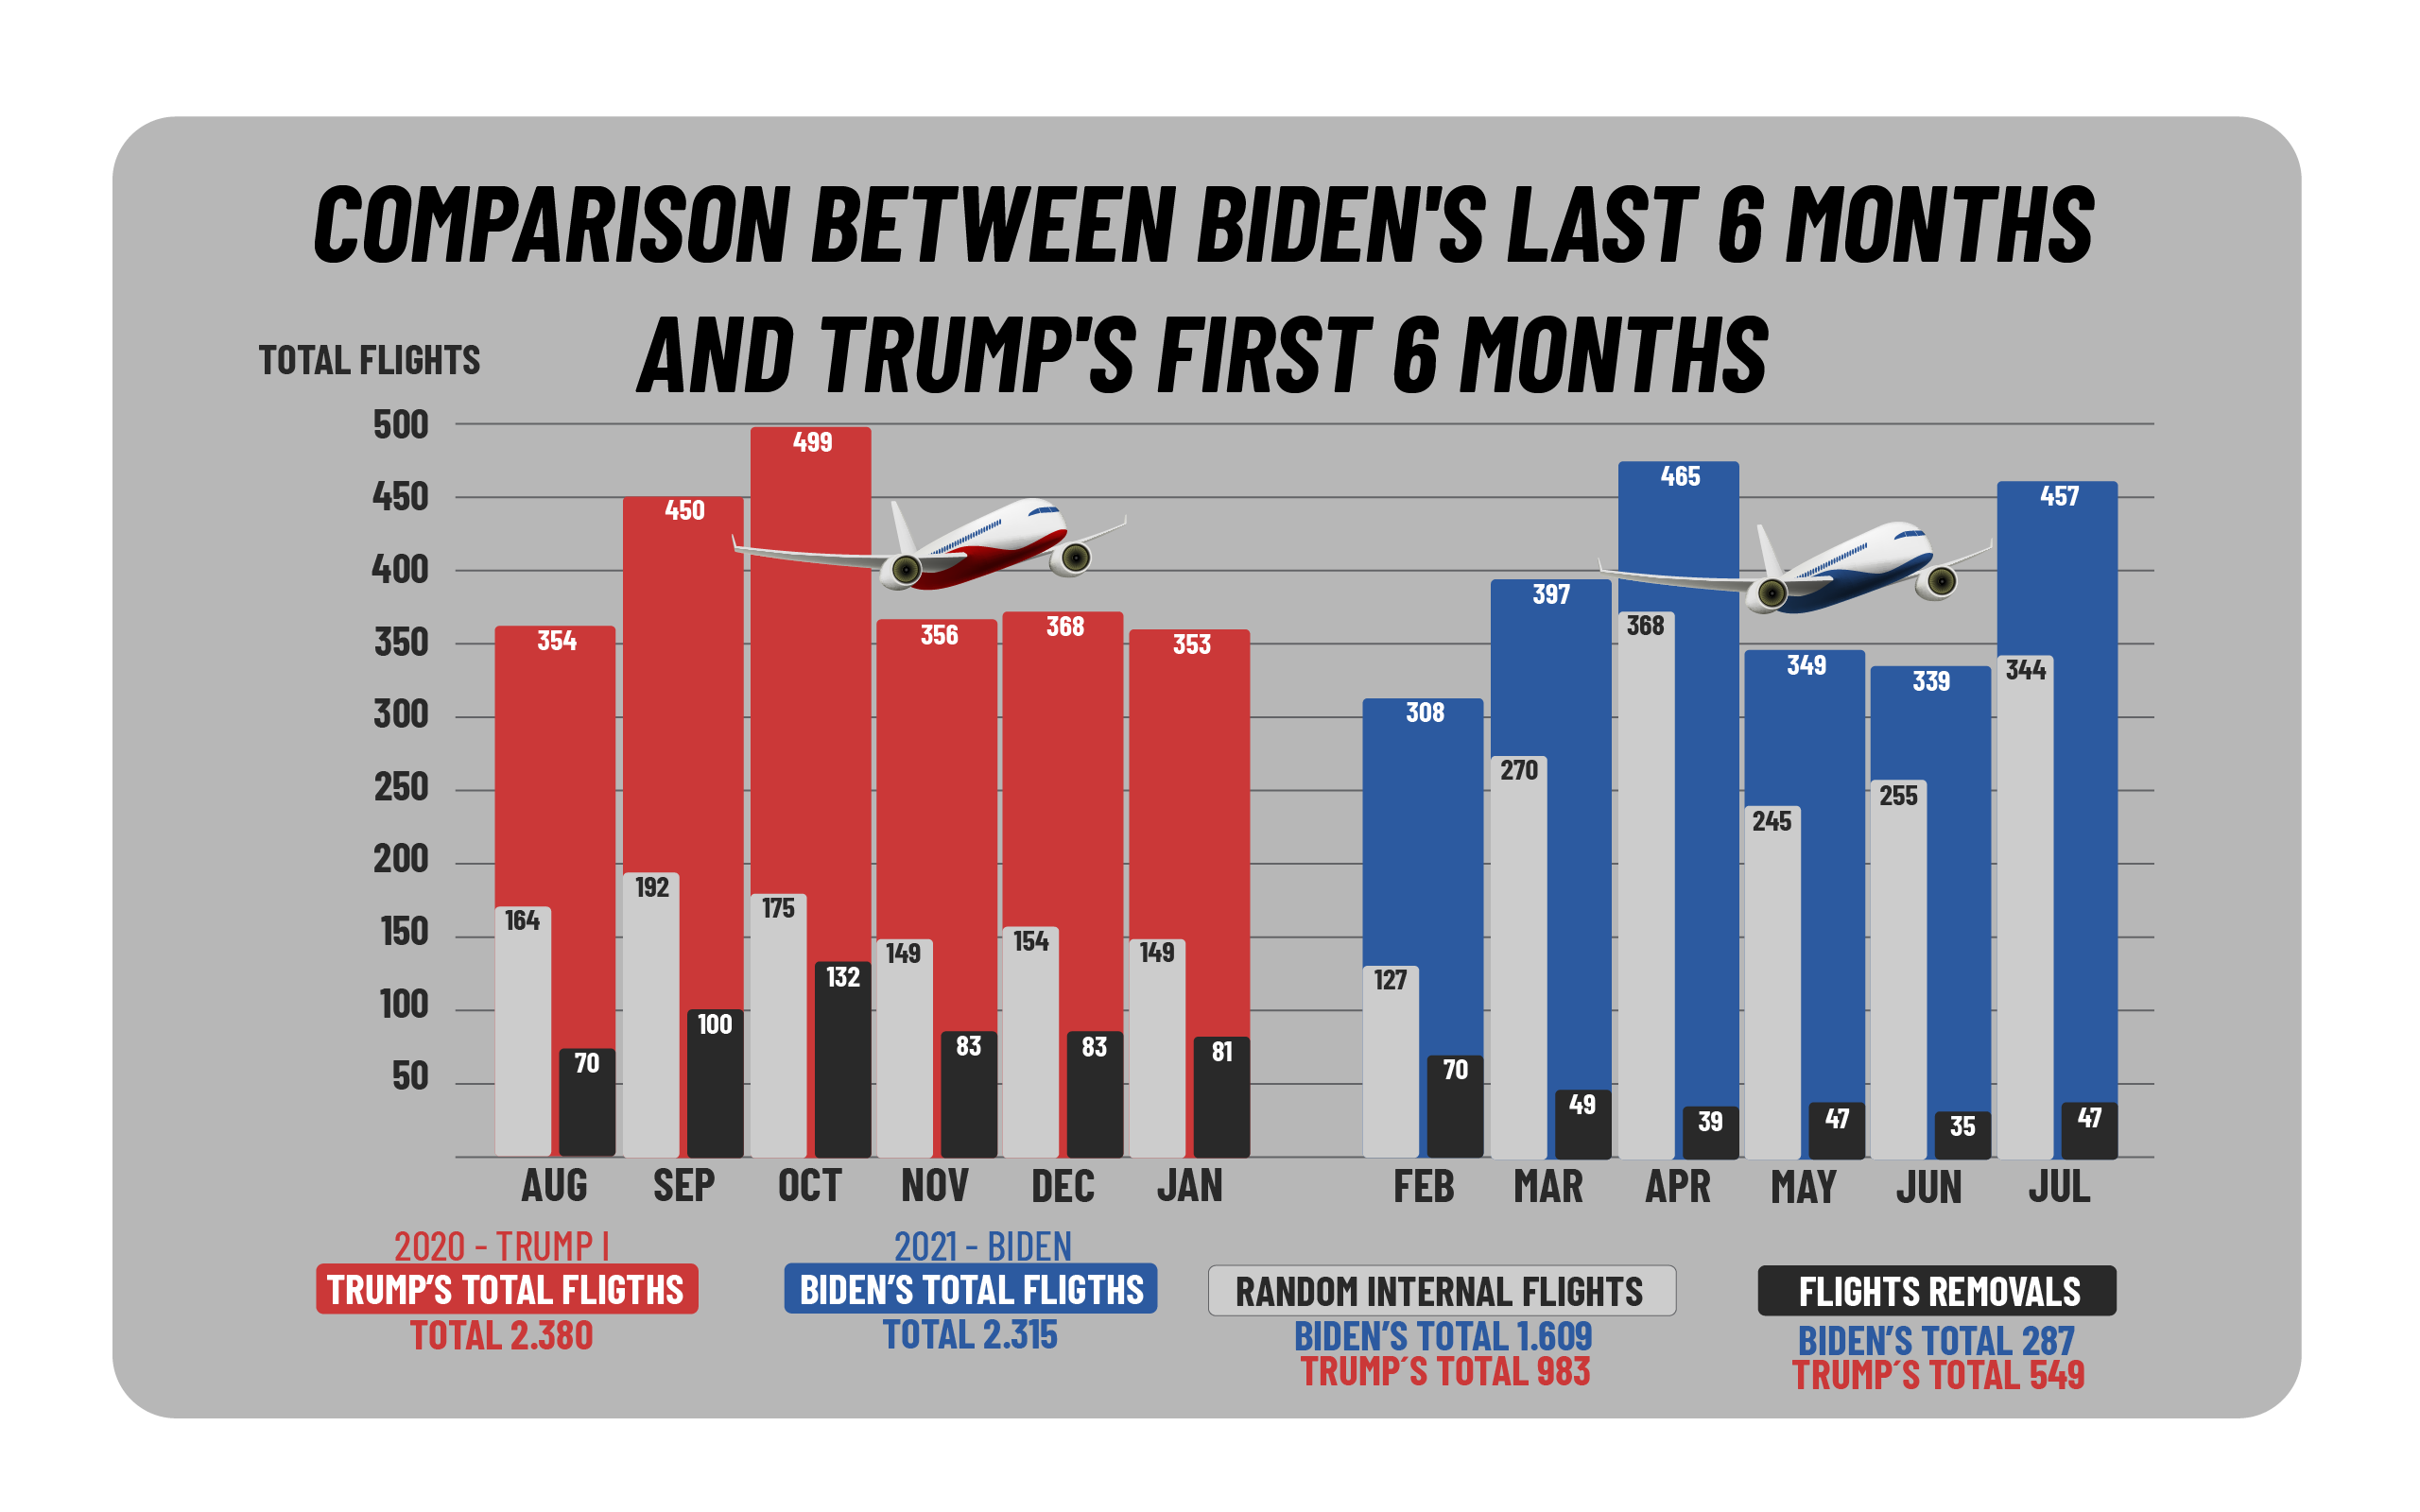
Comparing the last six months of the Trump administration with those of the Biden administration, Biden closed his term with a higher total number of flights, but a lower percentage of removals. In the second half of 2024, ICE conducted 3,606 flights, of which 706 were removals (19.5%). In contrast, during the last half of 2020, under Trump administration, 2,380 flights were recorded, with 23% being removals.
| LAST 6 MONTHS TRUMP 1.0 VS LAST 6 MONTHS BIDEN | |||||||
|---|---|---|---|---|---|---|---|
| 2020 – Trump I | Total Flights | Removal Flights | Internal Flights | 2024 – Biden | Total Flights | Removal Flights | Internal Flights |
| August | 354 | 70 | 164 | August | 679 | 135 | 359 |
| September | 450 | 100 | 192 | September | 580 | 105 | 320 |
| October | 499 | 132 | 175 | October | 623 | 123 | 313 |
| November | 356 | 83 | 149 | November | 563 | 107 | 299 |
| December | 368 | 83 | 154 | December | 627 | 127 | 314 |
| Jan-21 | 353 | 81 | 149 | Jan-25 | 534 | 109 | 273 |
| TOTAL | 2,380 | 549 | 983 | 3,606 | 706 | 1,878 | |
The first months of the current administration reflect a trend consistent with the policies of each administration. While during the start of Biden’s term, a total of 2,315 flights were carried out, of which only 287 were for removals (12%), during the Trump 2.0 administration, 5,756 flights have been recorded, with 992 for removals, equivalent to 17%.
| FIRST 6 MONTHS TRUMP VS FIRST 6 MONTHS BIDEN | |||||||
|---|---|---|---|---|---|---|---|
| 2021 – Biden | Total Flights | Removal Flights | Internal Flights | 2025 – Trump II | Total Flights | Removal Flights | Internal Flights |
| February | 308 | 70 | 127 | February | 638 | 126 | 358 |
| March | 397 | 49 | 270 | March | 807 | 134 | 496 |
| April | 465 | 39 | 368 | April | 827 | 126 | 501 |
| May | 349 | 47 | 245 | May | 1083 | 190 | 598 |
| June | 339 | 35 | 255 | June | 1187 | 209 | 697 |
| July | 457 | 47 | 344 | July | 1214 | 207 | 727 |
| TOTAL | 2,315 | 287 | 1,609 | 5,756 | 992 | 3,377 | |
Analysis of 5,756 ICE flights: frequency, routes, and estimated number of deportees
Between February and July, ICE handled a total of 5,756 flights. In February, there were 638 operations (126 removals and 358 internal transfers of immigrants), in March, 807 (134 removals and 496 transfers), in April, 827 (126 removals and 501 transfers), in May, 1,083 (190 removals and 598 transfers), in June, 1,187 (209 removals and 697 transfers), and in July, 1,214 (207 removals and 727 transfers).
Of the 992 removal flights coordinated by ICE: 126 left in February , including 19 military personnel; in March, 134 of these 8 military personnel left; in April the figure was 126, including 1 military personnel from Guantanamo to El Salvador; in May , there were 190, of these 4 military personnel; in June , the figure rose to 209, including 10 military personnel; and in July , 207 flights were recorded, including 18 military personnel.
How did military flights operate?
Of the military deportations, 9 passed through Guantánamo: 2 to El Salvador, 1 to Haiti, and 6 to African countries. What is unclear is the nationality of the passengers on the planes leaving the U.S. and of those picked up at Guantánamo. Furthermore, of the 52 routes (68 deportation stops), 20 originated in Harlingen , 13 in El Paso ( Biggs ), 6 in San Diego (Miramar), 5 in Alexandria, 5 in Guantánamo, 2 in Djibouti, and 1 in Tucson.
The investigation estimates that the number of people deported on military aircraft could be between 3,500 and 4,000, based on statistics provided by the receiving countries and taking into account that the capacity per plane is typically 80 people.
To which countries are immigrants being deported by air?
According to a study by the organization Witness at the Border , between February and July, ICE authorized 992 deportation flights. The main destinations were Guatemala, with 235 flights (24%); Honduras, 198 (20%); Mexico, 127 (13%); El Salvador, 99 (10%); Ecuador, 42 (4%); Venezuela, 39 (4%); Nicaragua, 23 (2%); the Dominican Republic, 20 (2%); Peru, 20 (2%); and Brazil, 13 (1%). In addition, 176 flights were recorded to other unspecified destinations, which together represent 18% of the total removals.
From which territories are ICE flights carrying deportees departing?
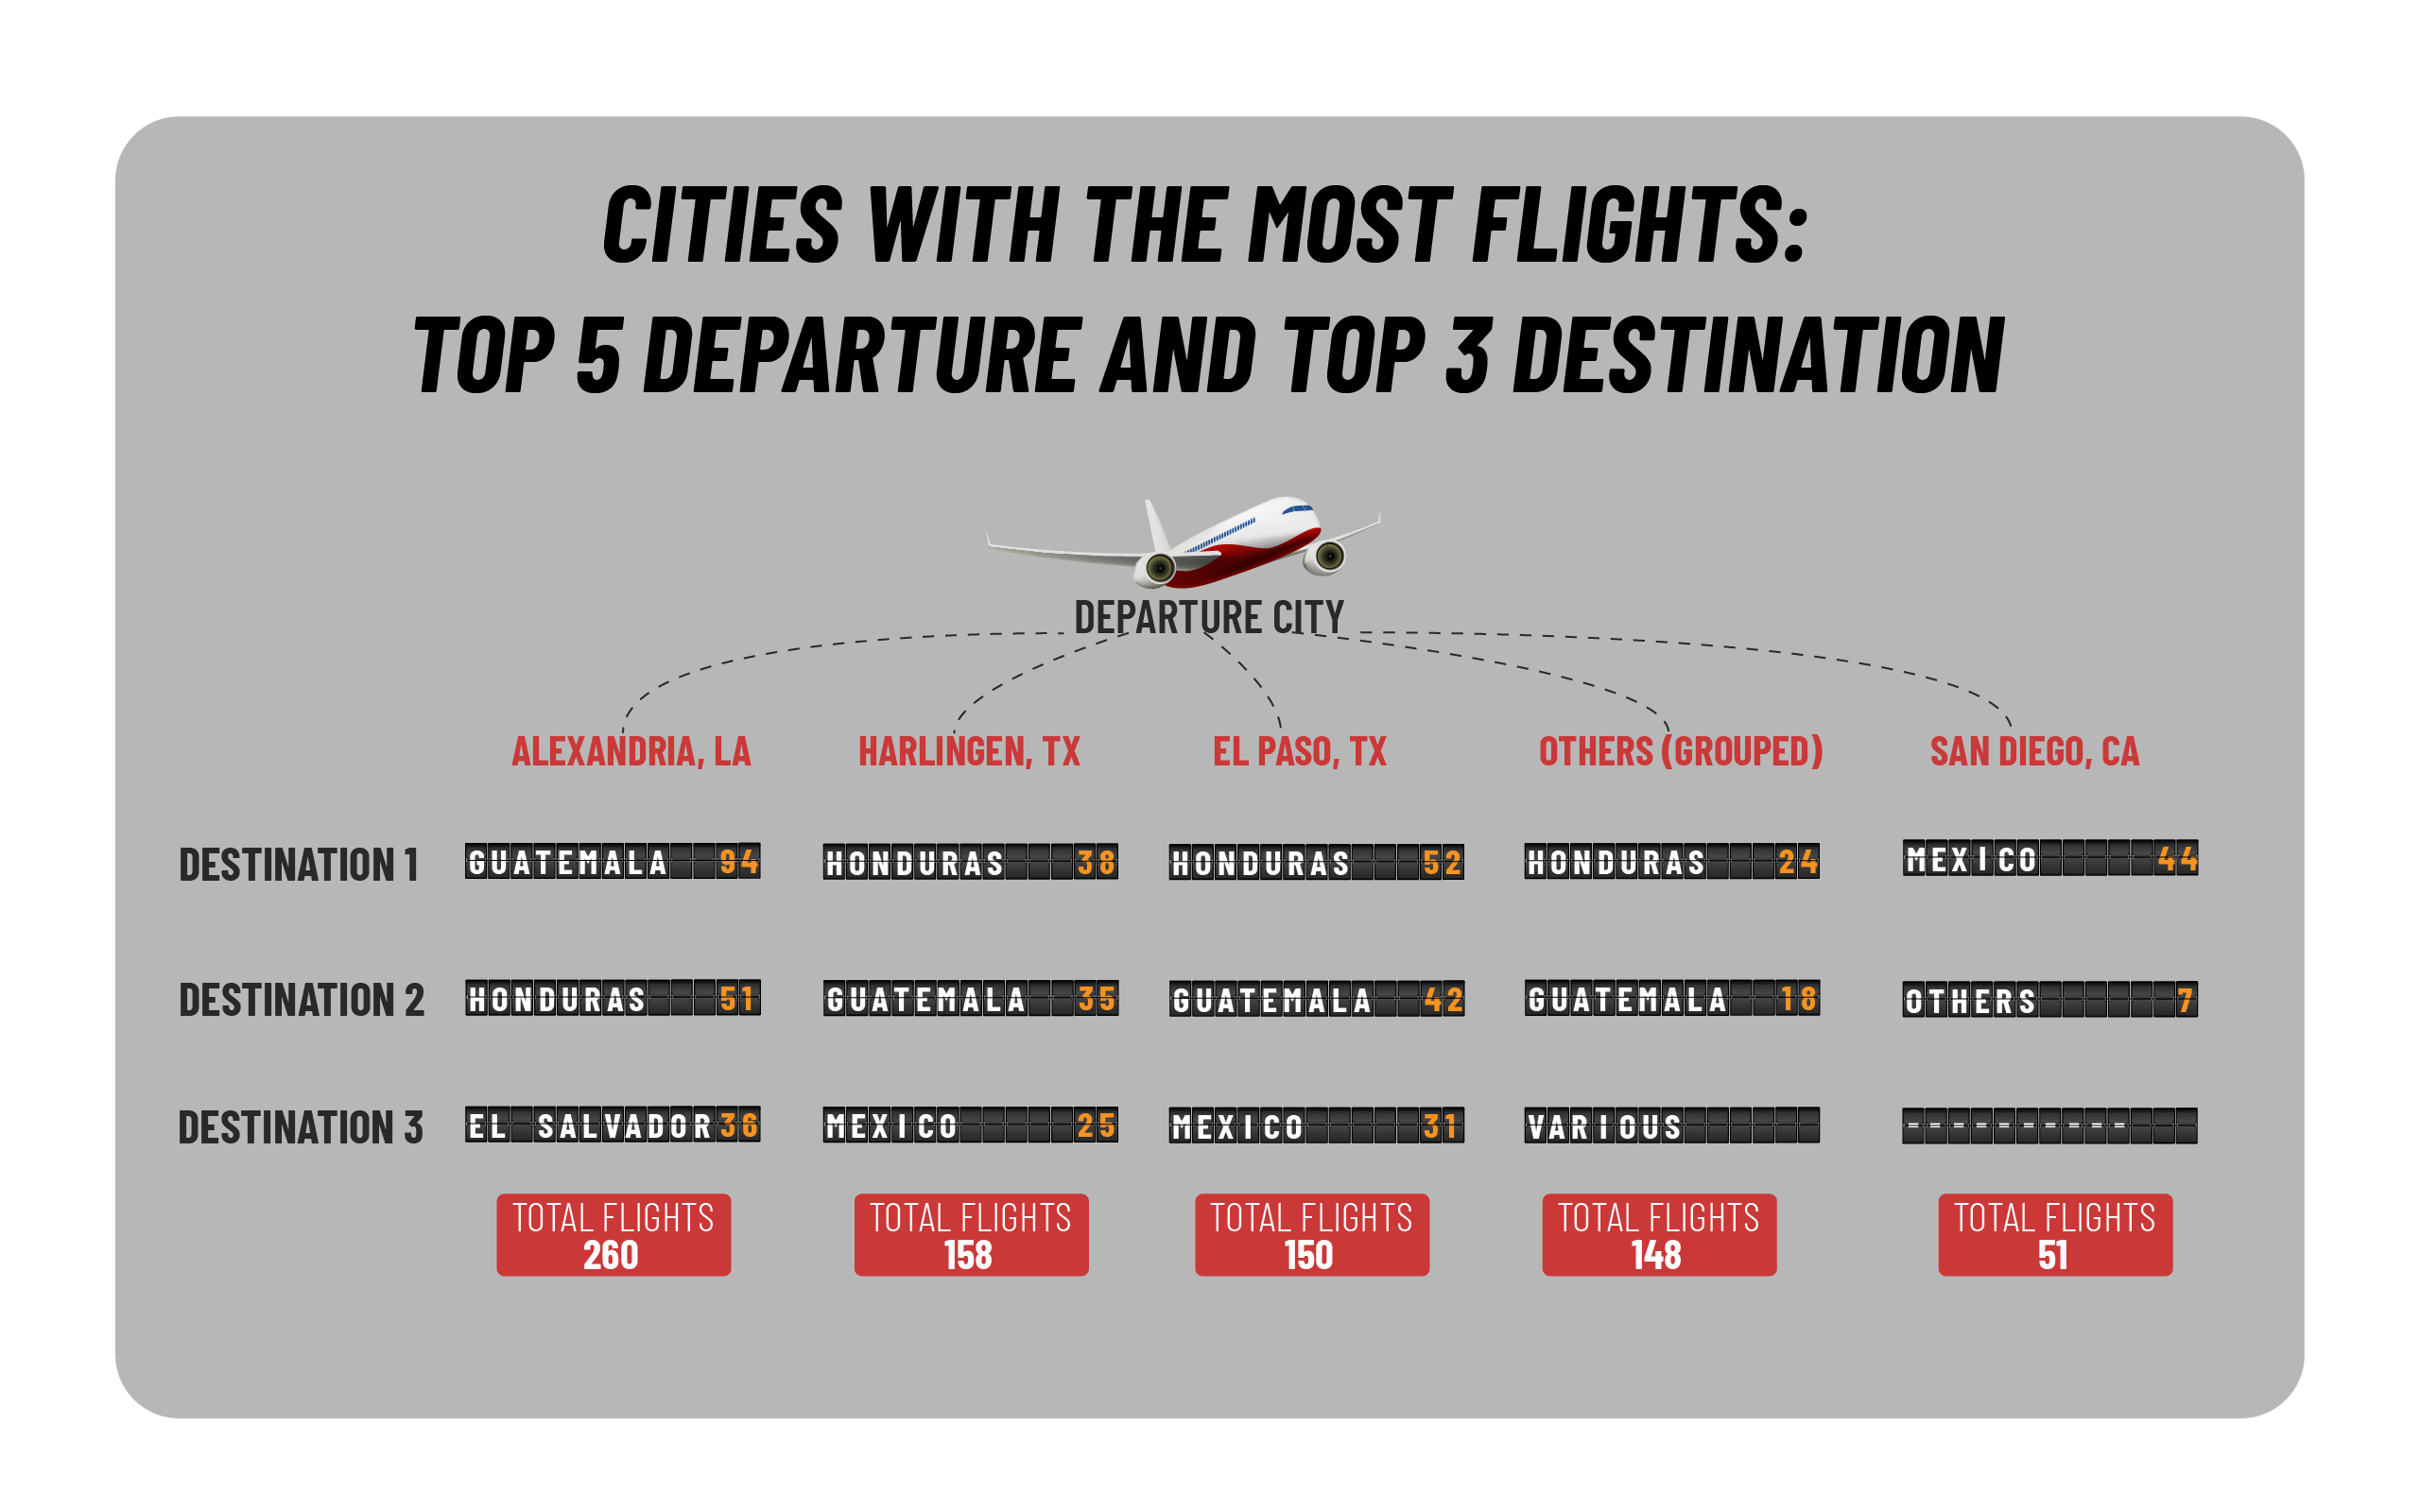
The list of departure cities is led by Alexandria, Louisiana , with 260 flights (26%) between February and July 2025, to nine countries . It is followed by Harlingen, Texas , with 158 flights (16%) to ten countries , and El Paso, Texas , with 150 flights (15%) to seven countries . Also on the list are San Diego, California , with 51 flights (5%) to three countries ; Honduras , with 48 flights (5%) to four countries. Then there is Miami, Florida , with 36 flights (4%) to at least five destinations, and Guantanamo , with 28 flights (3%) to at least seven countries.
The list is completed by Houston, Texas (26 flights, 3%), Guatemala City, Guatemala (25 flights, 3%), Comayagua, Honduras (20 flights, 2%), and San Juan, Puerto Rico (20 flights, 2%). Finally, there are 170 additional flights (17%) that departed from other unspecified cities , bound for 12 countries .
Texas stands out as one of the states with the most flights carrying immigrants, with 334 flights, representing 34% of the total departures to other countries.
Are more immigrants moving internally than leaving?
Since Trump returned to power, ICE has managed approximately 400 flights between Harlingen, Texas, and Alexandria, Louisiana; this statistic could indicate an overrate of internal transfers between the two territories, which would involve the movement of immigrants held by ICE from one detention center to another.
shows a clear trend, as of the total flights made during the first six months of the Trump administration in 2025, 3,377 were random flights for the transfer of immigrants, that is, 58% of the total mobilizations approved by ICE. In July alone, the analysis revealed a striking figure: 727 ICE flights into the interior of the country, becoming the highest number since 2020.
According to figures from the study by the organization Witness at the Border , some cities have concentrated the majority of domestic ICE flights with immigrants throughout 2025. Alexandria, Louisiana, leads the list with 693 flights (17%). It is followed by Harlingen (589 flights, 15%) and El Paso (460 flights, 12%), both in Texas. In the rest of the ranking appear Phoenix, Arizona with 270 flights (7%), Miami, Florida with 233 (6%) , San Antonio, Texas with 192 (5%) , Youngstown, Ohio with 131 (3%) , San Diego, California with 126 (3%) , Columbus, Georgia with 84 (2%) , Houston, Texas with 82 (2%) and Guantanamo , with 4 flights (less than 1%) . These figures are added to 1,063 additional flights (27%) whose destination was not specified, but which also transported thousands of immigrants within the United States.
The state of Texas deserves a special chapter, as it is the territory where the most random ICE immigration flights are arriving. Between February and July, the number has reached 1,323, which translates to 34% of the total number of such movements.
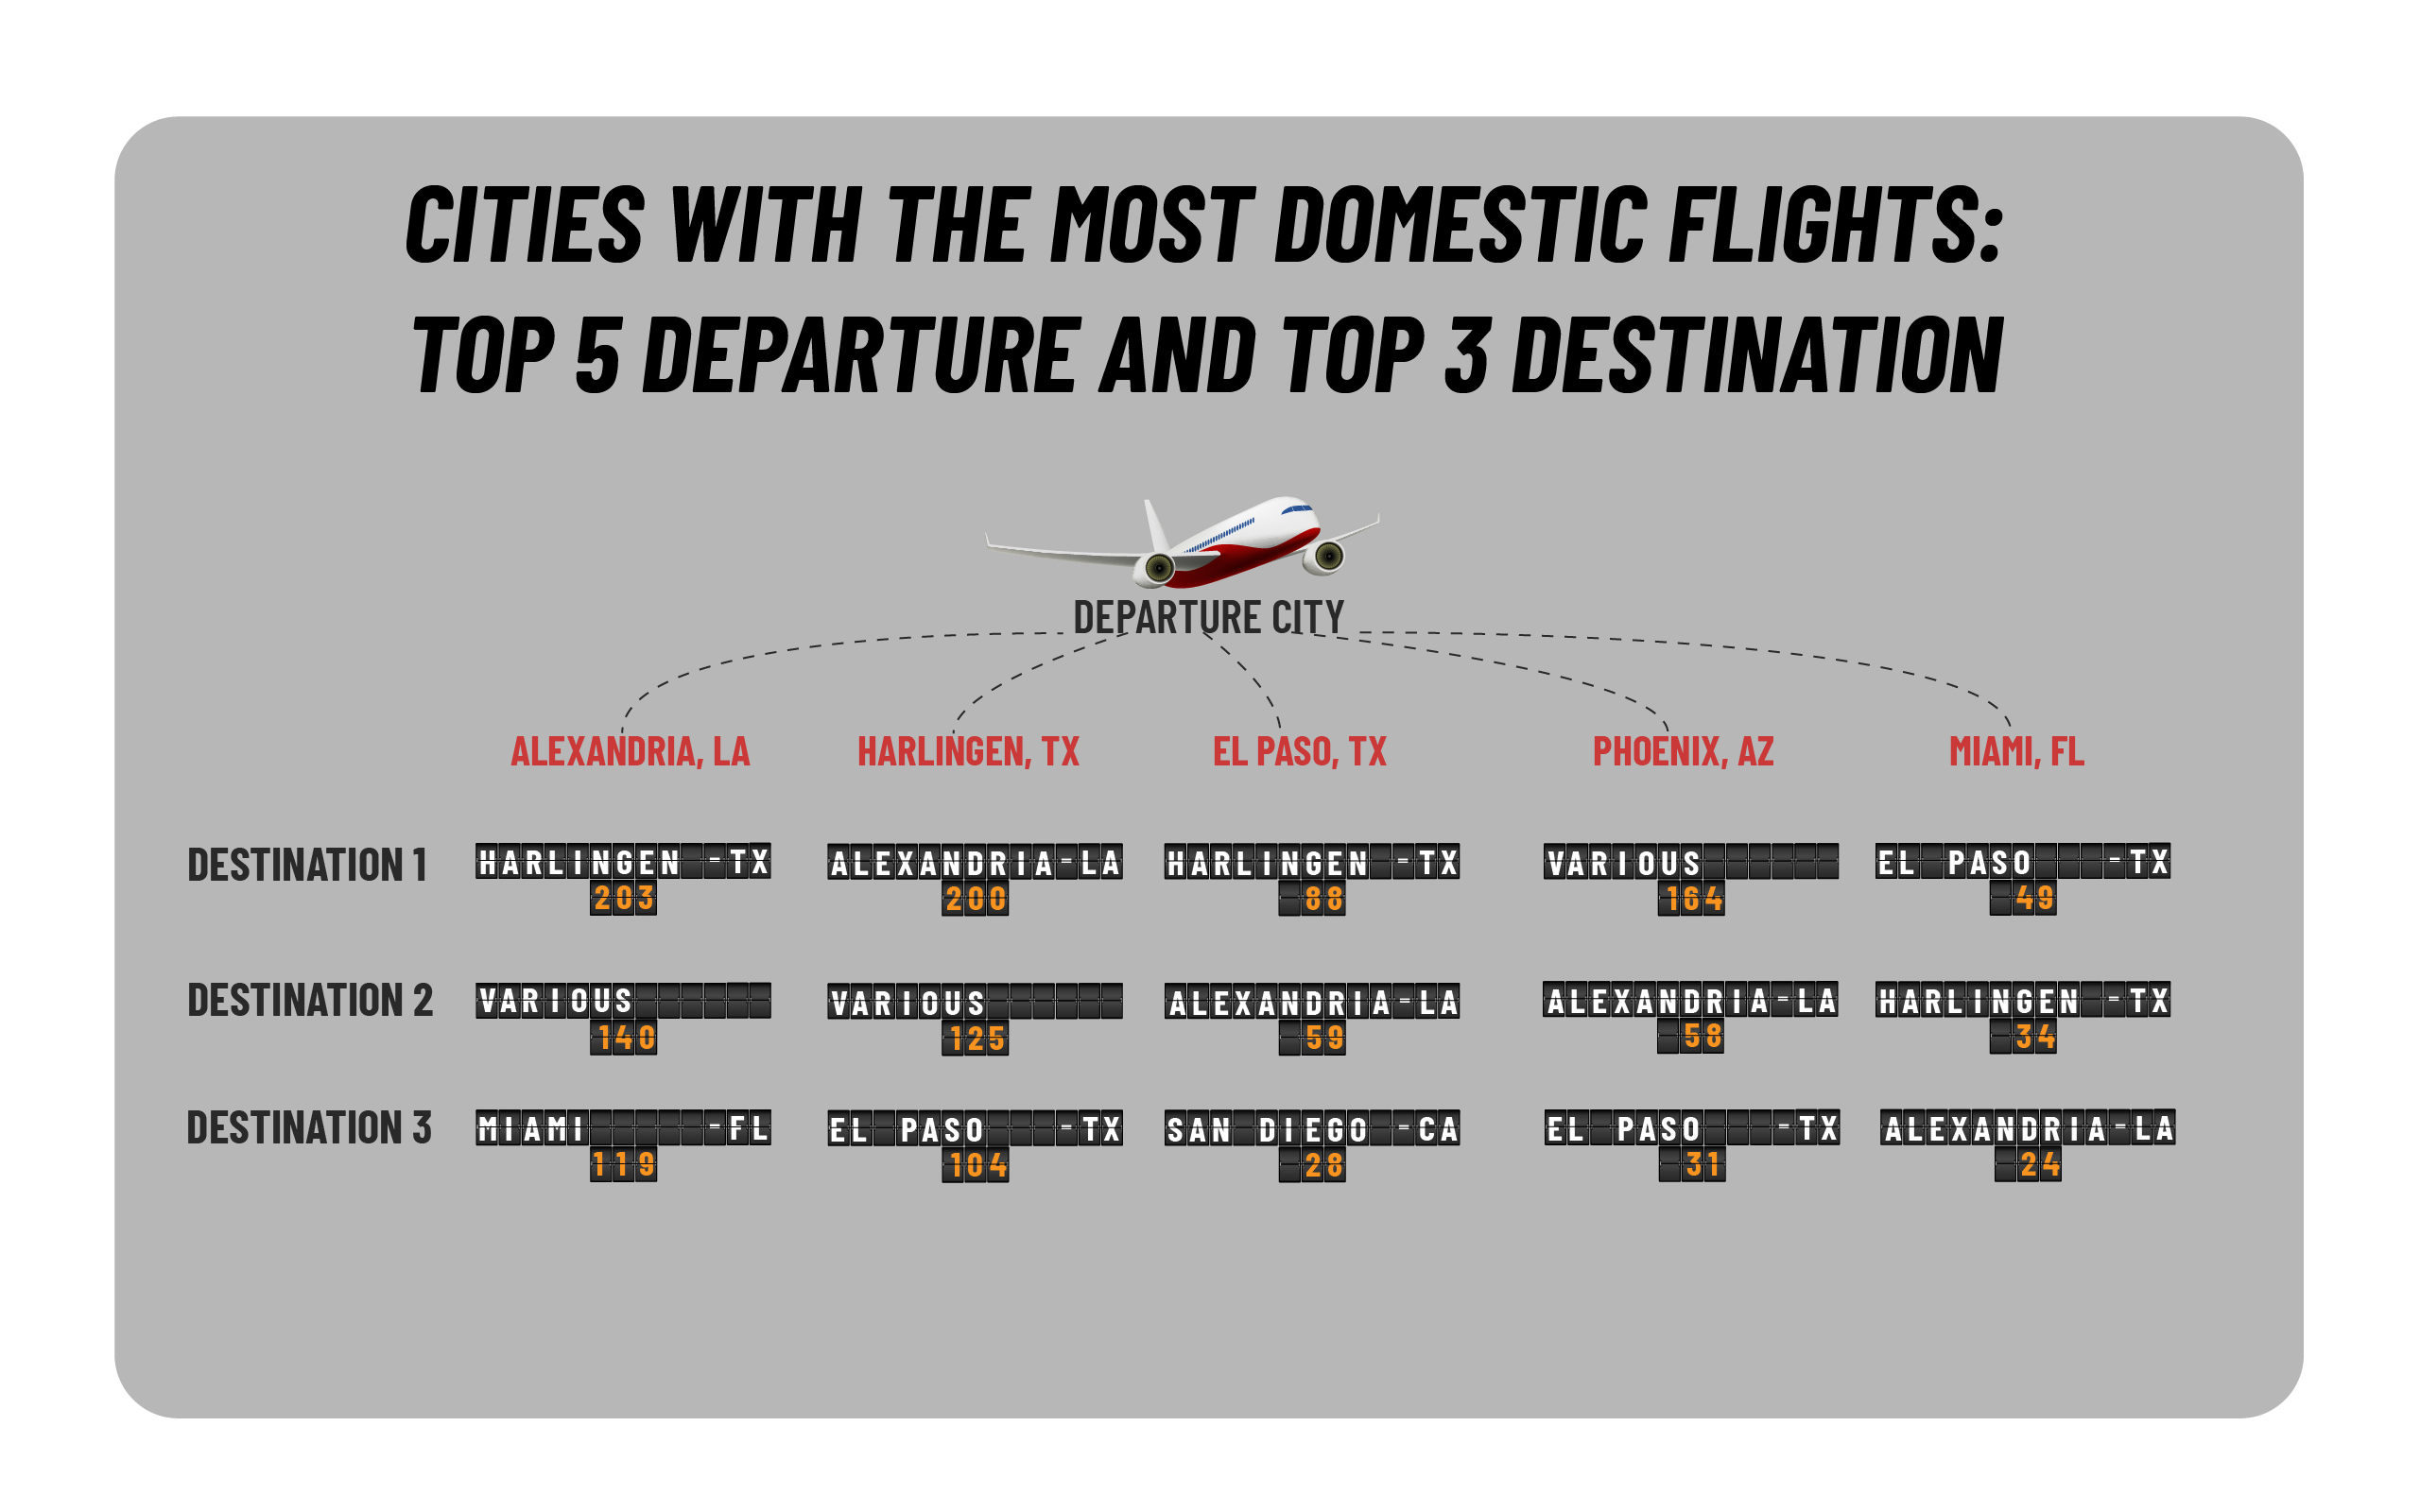
This may not be a mere coincidence, as we have found in other research I published (link to the ICE beds article) that, during fiscal year 2025, ICE has relied primarily on detention centers in Texas to house the largest number of immigrants. According to data updated as of June 23, 2025, by TRAC Immigration, of the 20 largest facilities, 6 were located in Texas. ( ICE Contractual Capacity and Number Detained : Overcapacity vs. Overcrowding )
How does ICE operate deportation flights?
Through ICE Air Operations, the agency’s air division responsible for moving people within the U.S. (transfers between prisons/centers) and outside the U.S. (removals/deportations), using charter and, occasionally, commercial flights.
ICE Air employs different types of aircraft depending on the nature of each operation. For daily routine transfers, it uses B737 or MD80 series aircraft . For larger, high-risk special charter missions, it uses larger aircraft, from B737s to B777s . Finally, for smaller-scale, but still high-risk, special operations, it leases executive jets, such as the Gulfstream IV or equivalent models.
According to their website, the average cost of a flight is $8,577 per flight hour. Meanwhile, the average cost of a high-risk special charter flight ranges from $6,929 to $26,795 per hour, depending on the aircraft’s requirements. These fees cover not only the cost of the aircraft and fuel, but also the cost of the crew, security personnel, an onboard medical professional, and all associated aviation management and overflight costs. ( ICE Air Operations) prioritizes safety and security for its passengers | ICE )
How much could these ICE flights cost?
Although the cost per person varies greatly depending on aircraft occupancy, route, mission type, and escorts, I conducted an exercise to calculate the values based on available data and trends.
For clearance flights (and those associated with these types of operations), an average flight time of three hours was used as a reference. The estimated hourly cost for a special charter was USD 13,500, which is half the normal price for this service.
Based on this calculation, the approximate expenditure between February and July could amount to USD 96,349,000, corresponding to 2,379 flights carried out during that period. For domestic flights, I also considered a general estimate (3 hours of flight time), with an average hourly rate for scheduled charter flights of $8,577. In this case, the cost that ICE would have spent in the first six months of the Trump administration would be approximately US $86,893,000 for 3,377 domestic flights.
In recent days, it became known that Department of Homeland Security Secretary Kristi Noem has floated the possibility of ICE having its own fleet of aircraft to deport immigrants. The goal would be for the agency itself to purchase and operate them using a grant from the agency.
Although the plan is still unclear, former officials have stated that this idea could be very costly for ICE, since acquiring and maintaining a fleet of its own aircraft entails other types of expenses.
