
Although the narrative of the current administration has focused its efforts on reporting the mass deportations it has been carrying out with undocumented immigrants and speaks of historic figures in this regard, the truth is that according to numbers I will discuss in this article, since January 2025, ICE has been releasing and monitoring more people through Alternatives to Detention (ATD), mainly with ankle monitors, than those recorded in the previous administration.
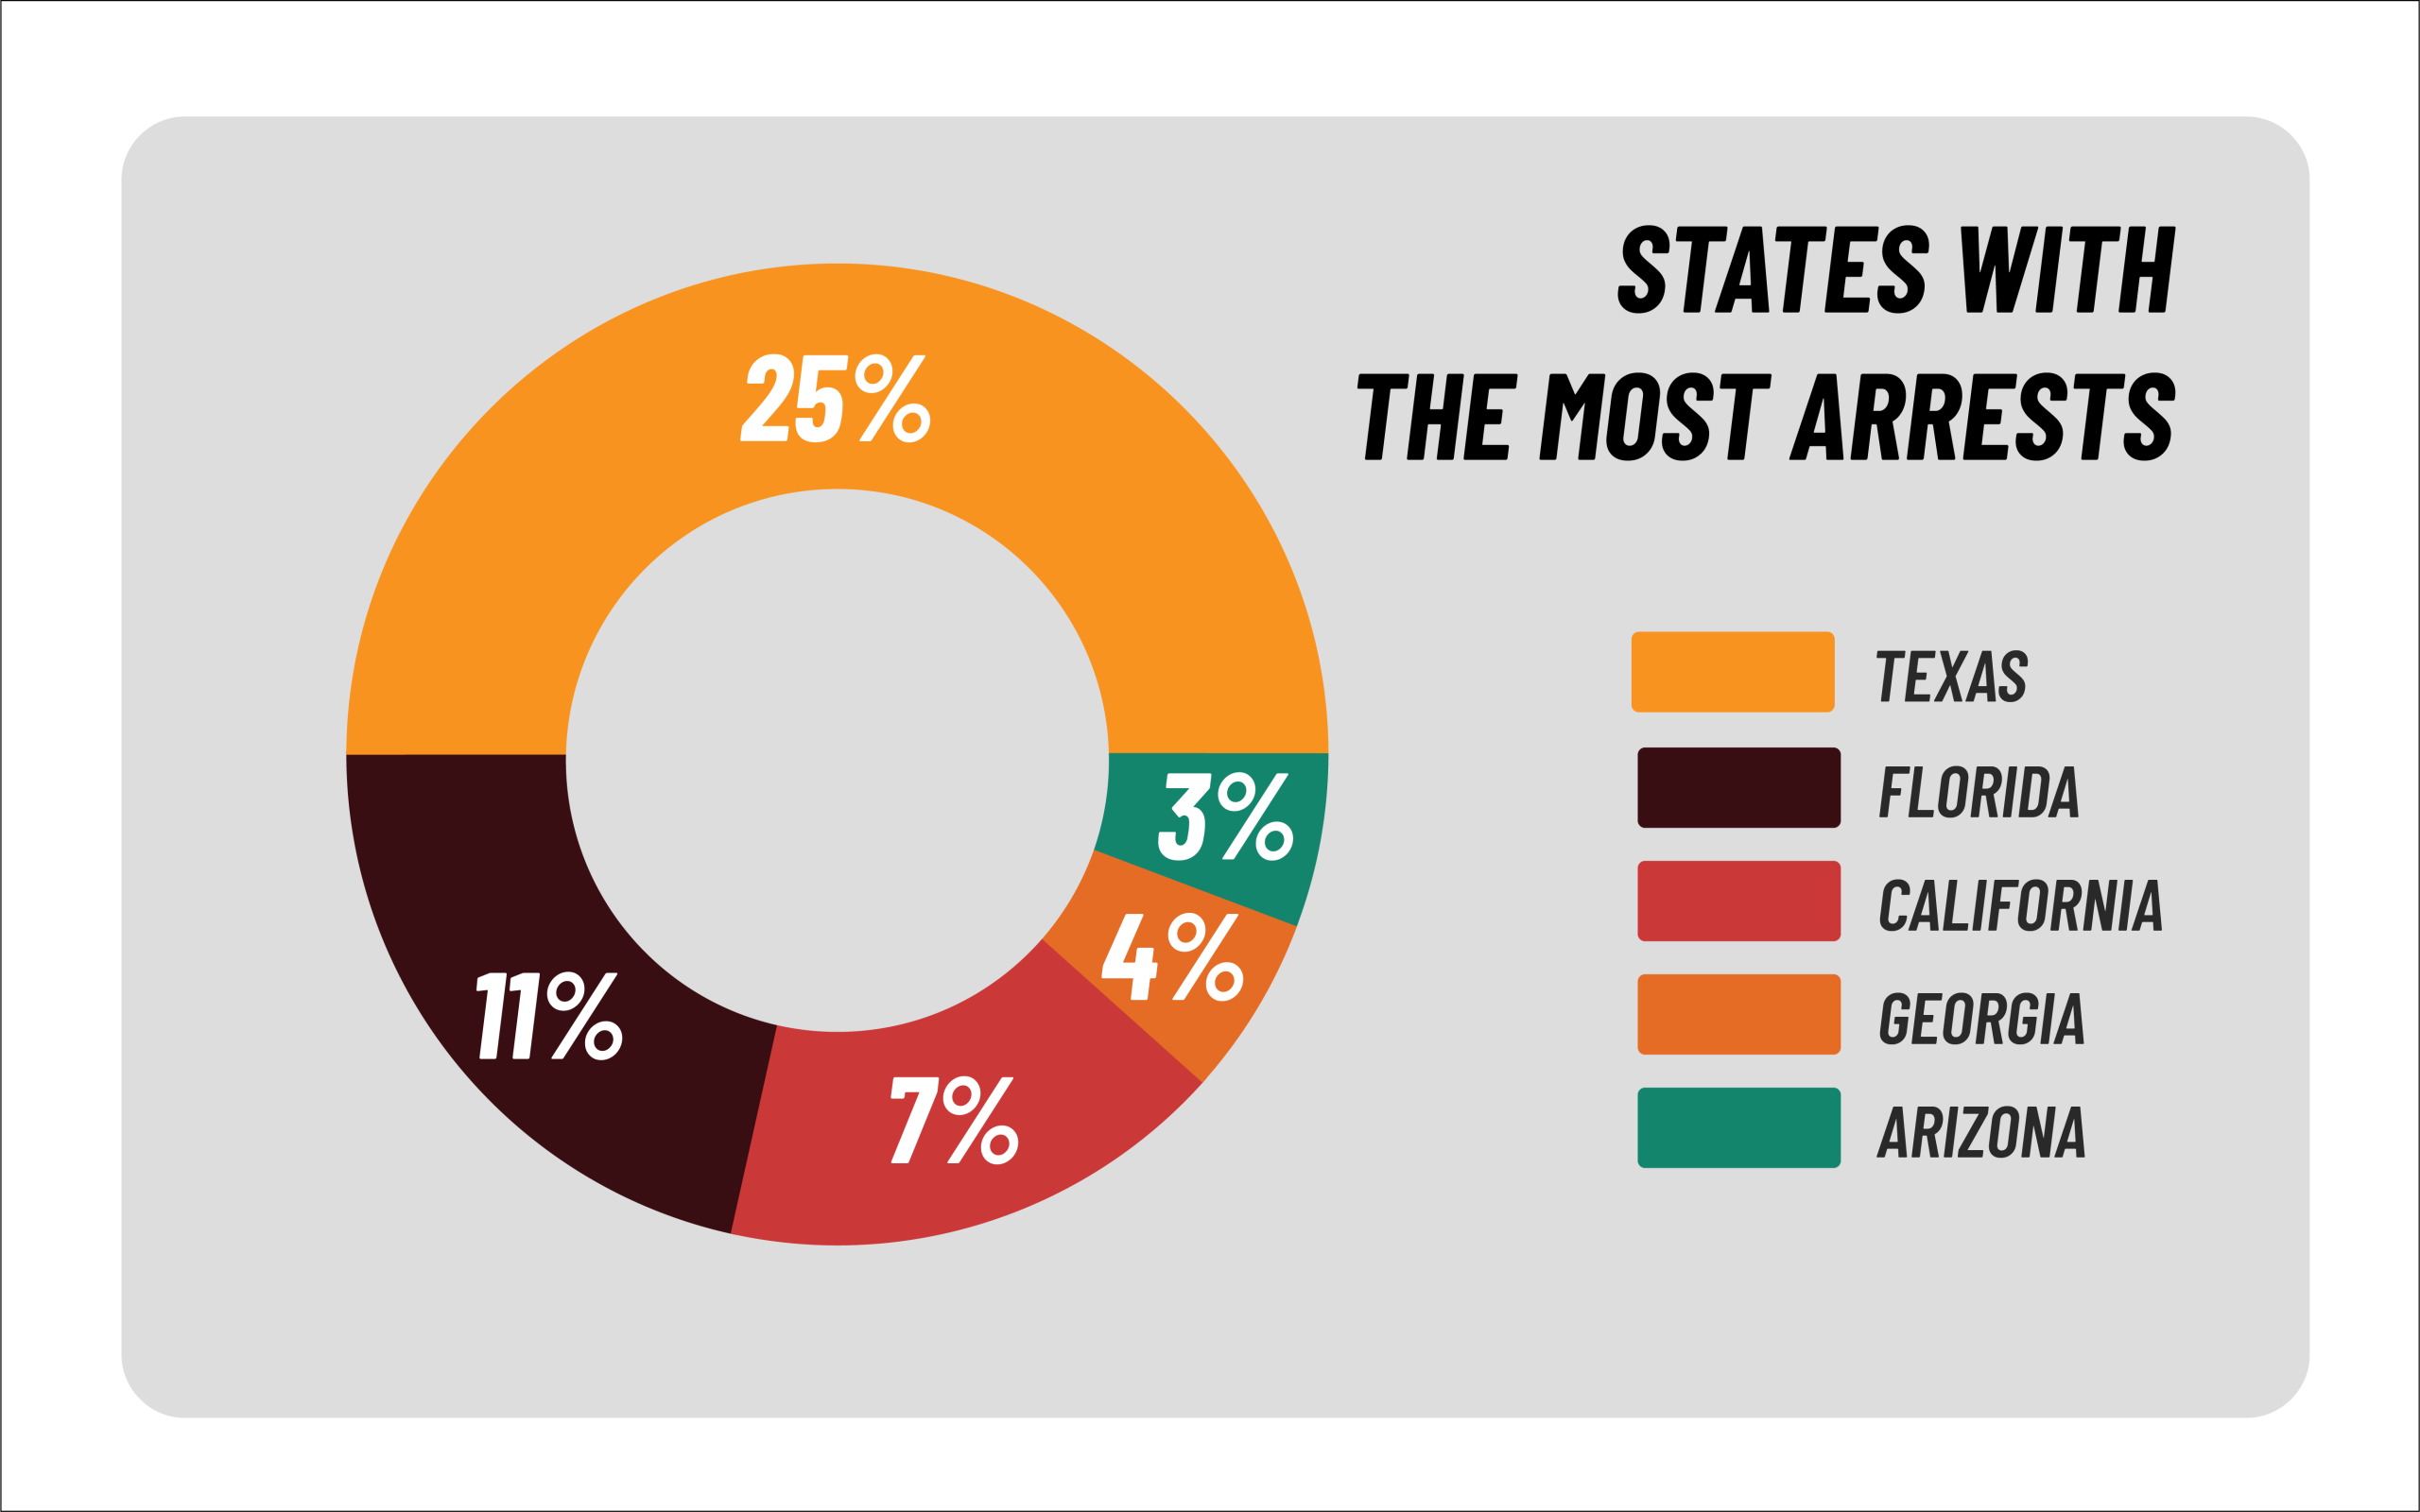
But to begin to contextualize the issue, let us first talk about arrests. According to reports from the organization Deportation Data Project, from January to June the United States Immigration and Customs Enforcement (ICE) has detained more than 109,000 immigrants. (https://deportationdata.org/data/ice.html). The statistics show that Texas topped the list of states with the most arrests with approximately 25%, followed by Florida with 11%, California with 7%, Georgia 4%, and Arizona 3%.
When comparing ICE figures in these first months of government with the same period in 2024, the report revealed a 120% increase in total detentions by this administration; since in 2024 the figure reached just over 49,000 arrests and today exceeds 109,000.
Regarding this, in 2024 the daily average of arrests by ICE remained stable at about 200. Once the new administration took office in 2025, the figure tripled, reaching about 600 daily. As of May, arrests increased even further reaching about 1,000 per day, a situation that coincided with the order to carry out 3,000 daily arrests entrusted to ICE. However, this goal is still far from being met and, in fact, the number of people arrested, at least by the end of June, decreased by approximately 800 people per day. (https://immresearch.org/publications/who-is-ice-arresting/)
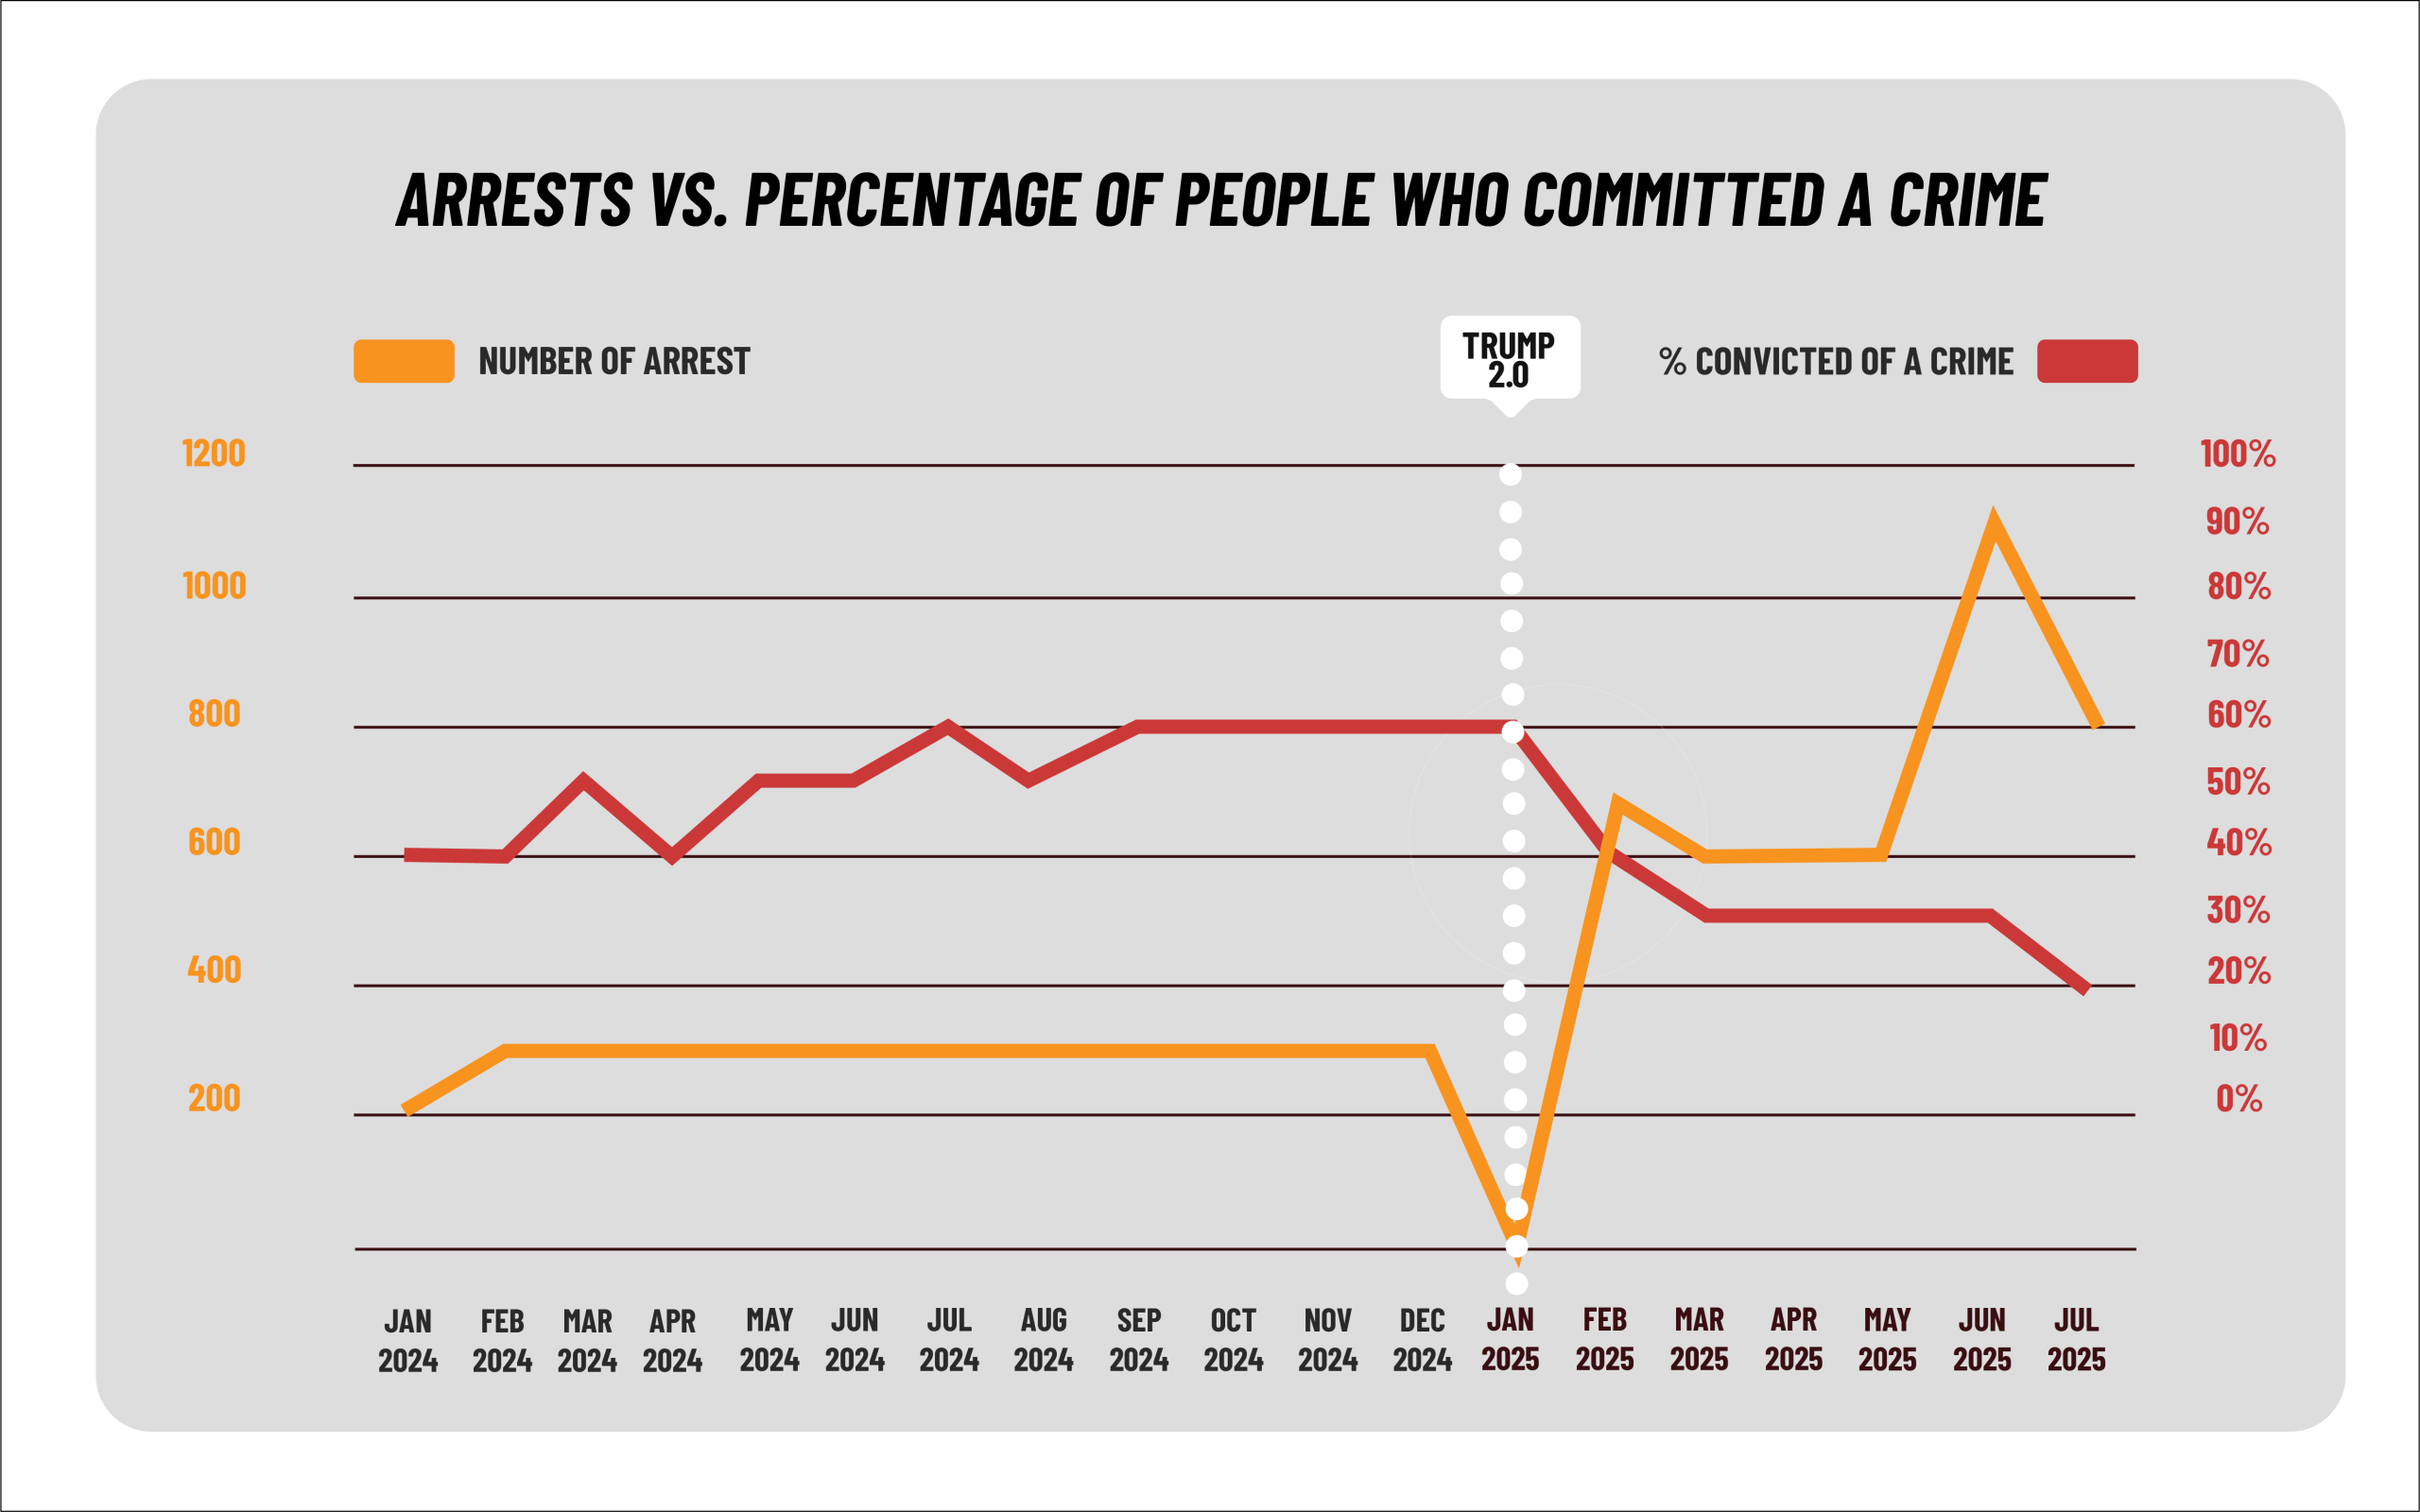
The higher the number of arrests, the lower the percentage of those convicted of a crime
Annex 1: Number of arrests vs. percentage of people who committed a crime.
At this point it is important to keep in mind that as incarcerations have been increasing, the number of those without criminal records has also multiplied, according to an analysis by the Immigration Research Organization.
It is essential to highlight that ICE often classifies as «convicted» people with pending or even dismissed criminal charges. For this reason, it is likely that the figures overestimate the real number of people being arrested due to the increase in immigration control measures.
In addition, some of those arrested by ICE are eventually released or placed under supervision with Alternatives to Detention (ATD), since they have complied with civil immigration law or have no criminal record.
From cells to ATD monitoring: a current reality
And although ICE’s immigration stances in the current administration are aimed at capturing as many immigrants as possible and, subsequently, generating deportation processes, it is surprising then that Alternatives to Detention (ATD) have become a valid option when it comes to releasing undocumented immigrants.
This is shown by figures we learned from both ICE and TRAC Immigration, which allow me to conclude that more people are being released with technological monitoring systems during this government, compared to the same period under Biden, something that is surprising and contradictory.
In this dashboard you will find information about the behavior of ATD use in recent years and a complete analysis with the most up-to-date figures on the number of immigrants with ankle devices and the figures by states, cities, and their percentage variations.
For example, the average of the first 6 months of Trump 2.0 (2025) is 93% higher than the same first 6 months of Biden (2021). It is worth noting that his main objective was not to generate processes of mass deportation as is the case with the current president. Regarding this matter, it can be analyzed that the trend of monthly increases is constant.
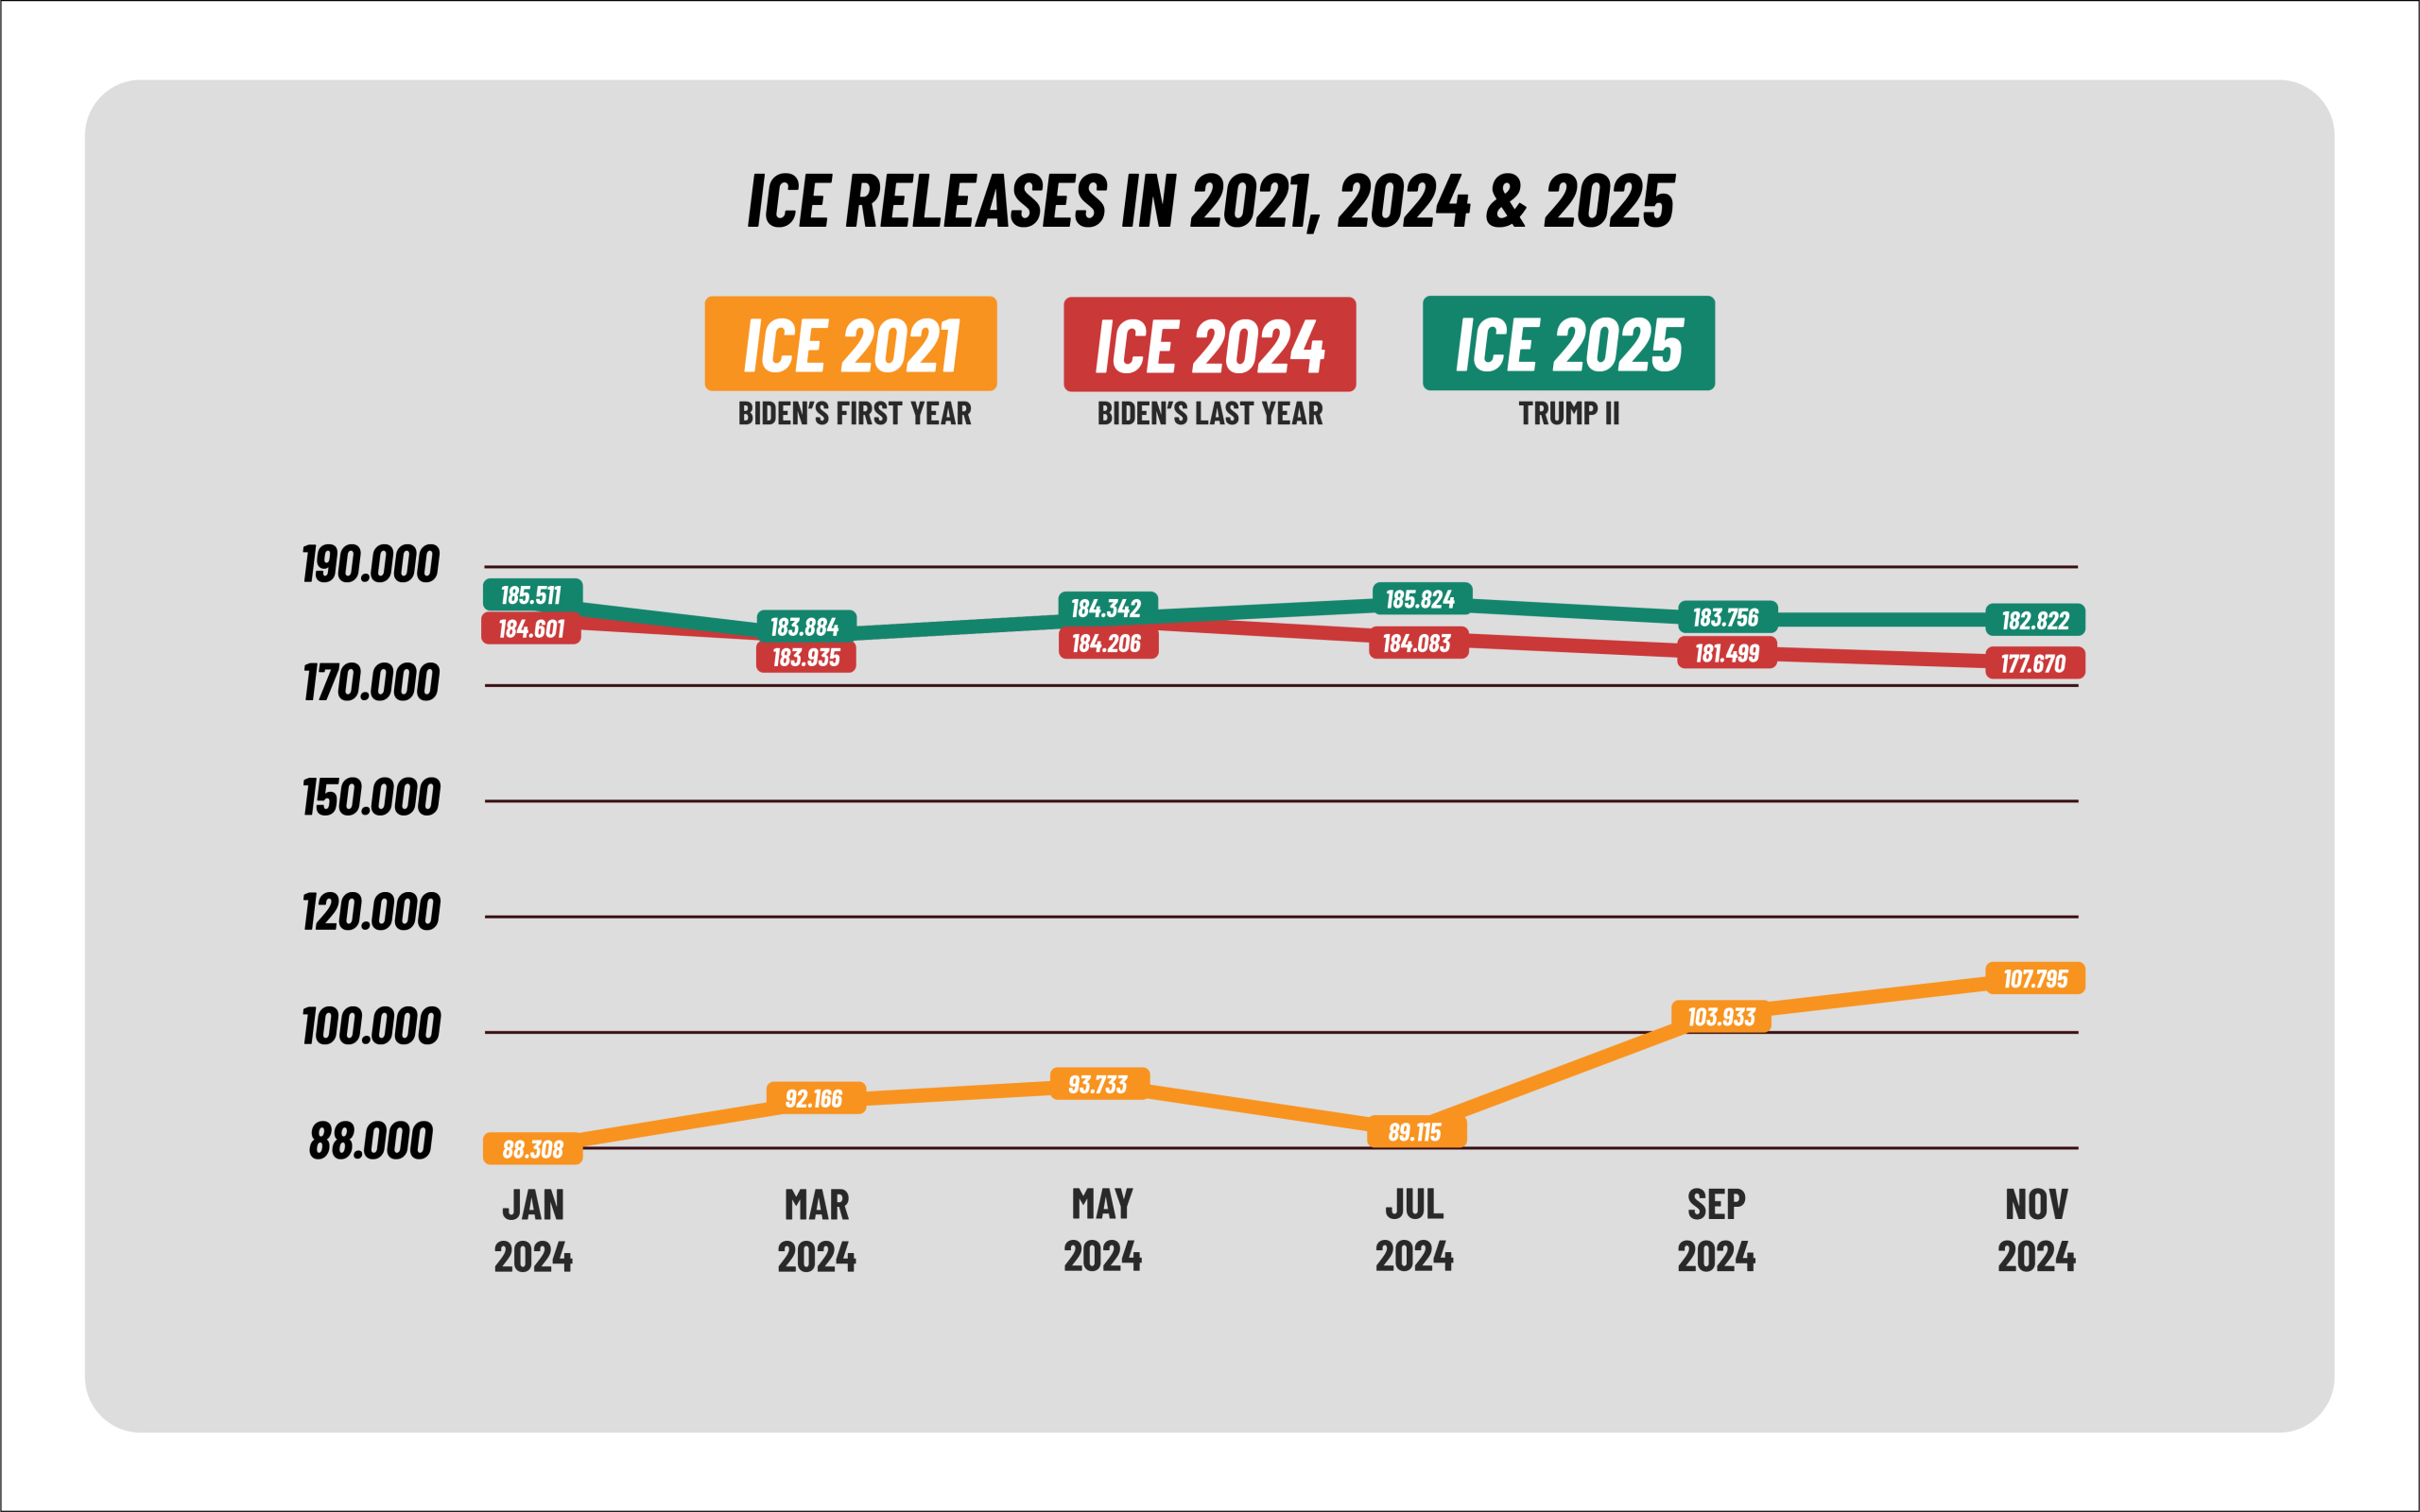
Let’s start with February 2021, in which 88,308 people were released via ATD, in the same month of 2025, the figure increased by 110% which represented a total of 185,511 releases. Meanwhile in March 2025, the number of people reached 183,884, representing an increase of 99.5% compared to the same period in 2021. In April, the increase was 96.6% going from 93,733 in 2021, to 184,342 in 2025. In May, the figure soared 108%, with 185,824 compared to 89,115 in May 2021. For June and July, the upward trend continued, with increases of 76.8% and 69.6%, respectively.
While in 2021 the figures of people with ATD fluctuated between 88 thousand and 107 thousand in the months of February and July, for 2025 the Trump 2.0 government nearly doubled many of these values and their numbers oscillate between 185 thousand and 182 thousand during the same months.
Additionally, when comparing ICE release figures in 2024 and 2025, statistics show that, monthly under this government, the number of people released with some type of surveillance technology is higher than that reported during the same period in 2024, except for March* when the record was surpassed by the previous administration by just 51 people. In July alone, ICE released 182,822 people with ATD supervision compared to 177,670 in the same month of 2024, that is, 3% more.
Annex 2. ICE releases in 2021, 2024, and 2025.
Access this link and find a dynamic table with information on ATD use behavior in recent years and a complete analysis with the most up-to-date figures on the number of immigrants with ankle devices, as well as figures by states, cities, and their percentage variations. You can filter by periods, states, cities, among other variables.
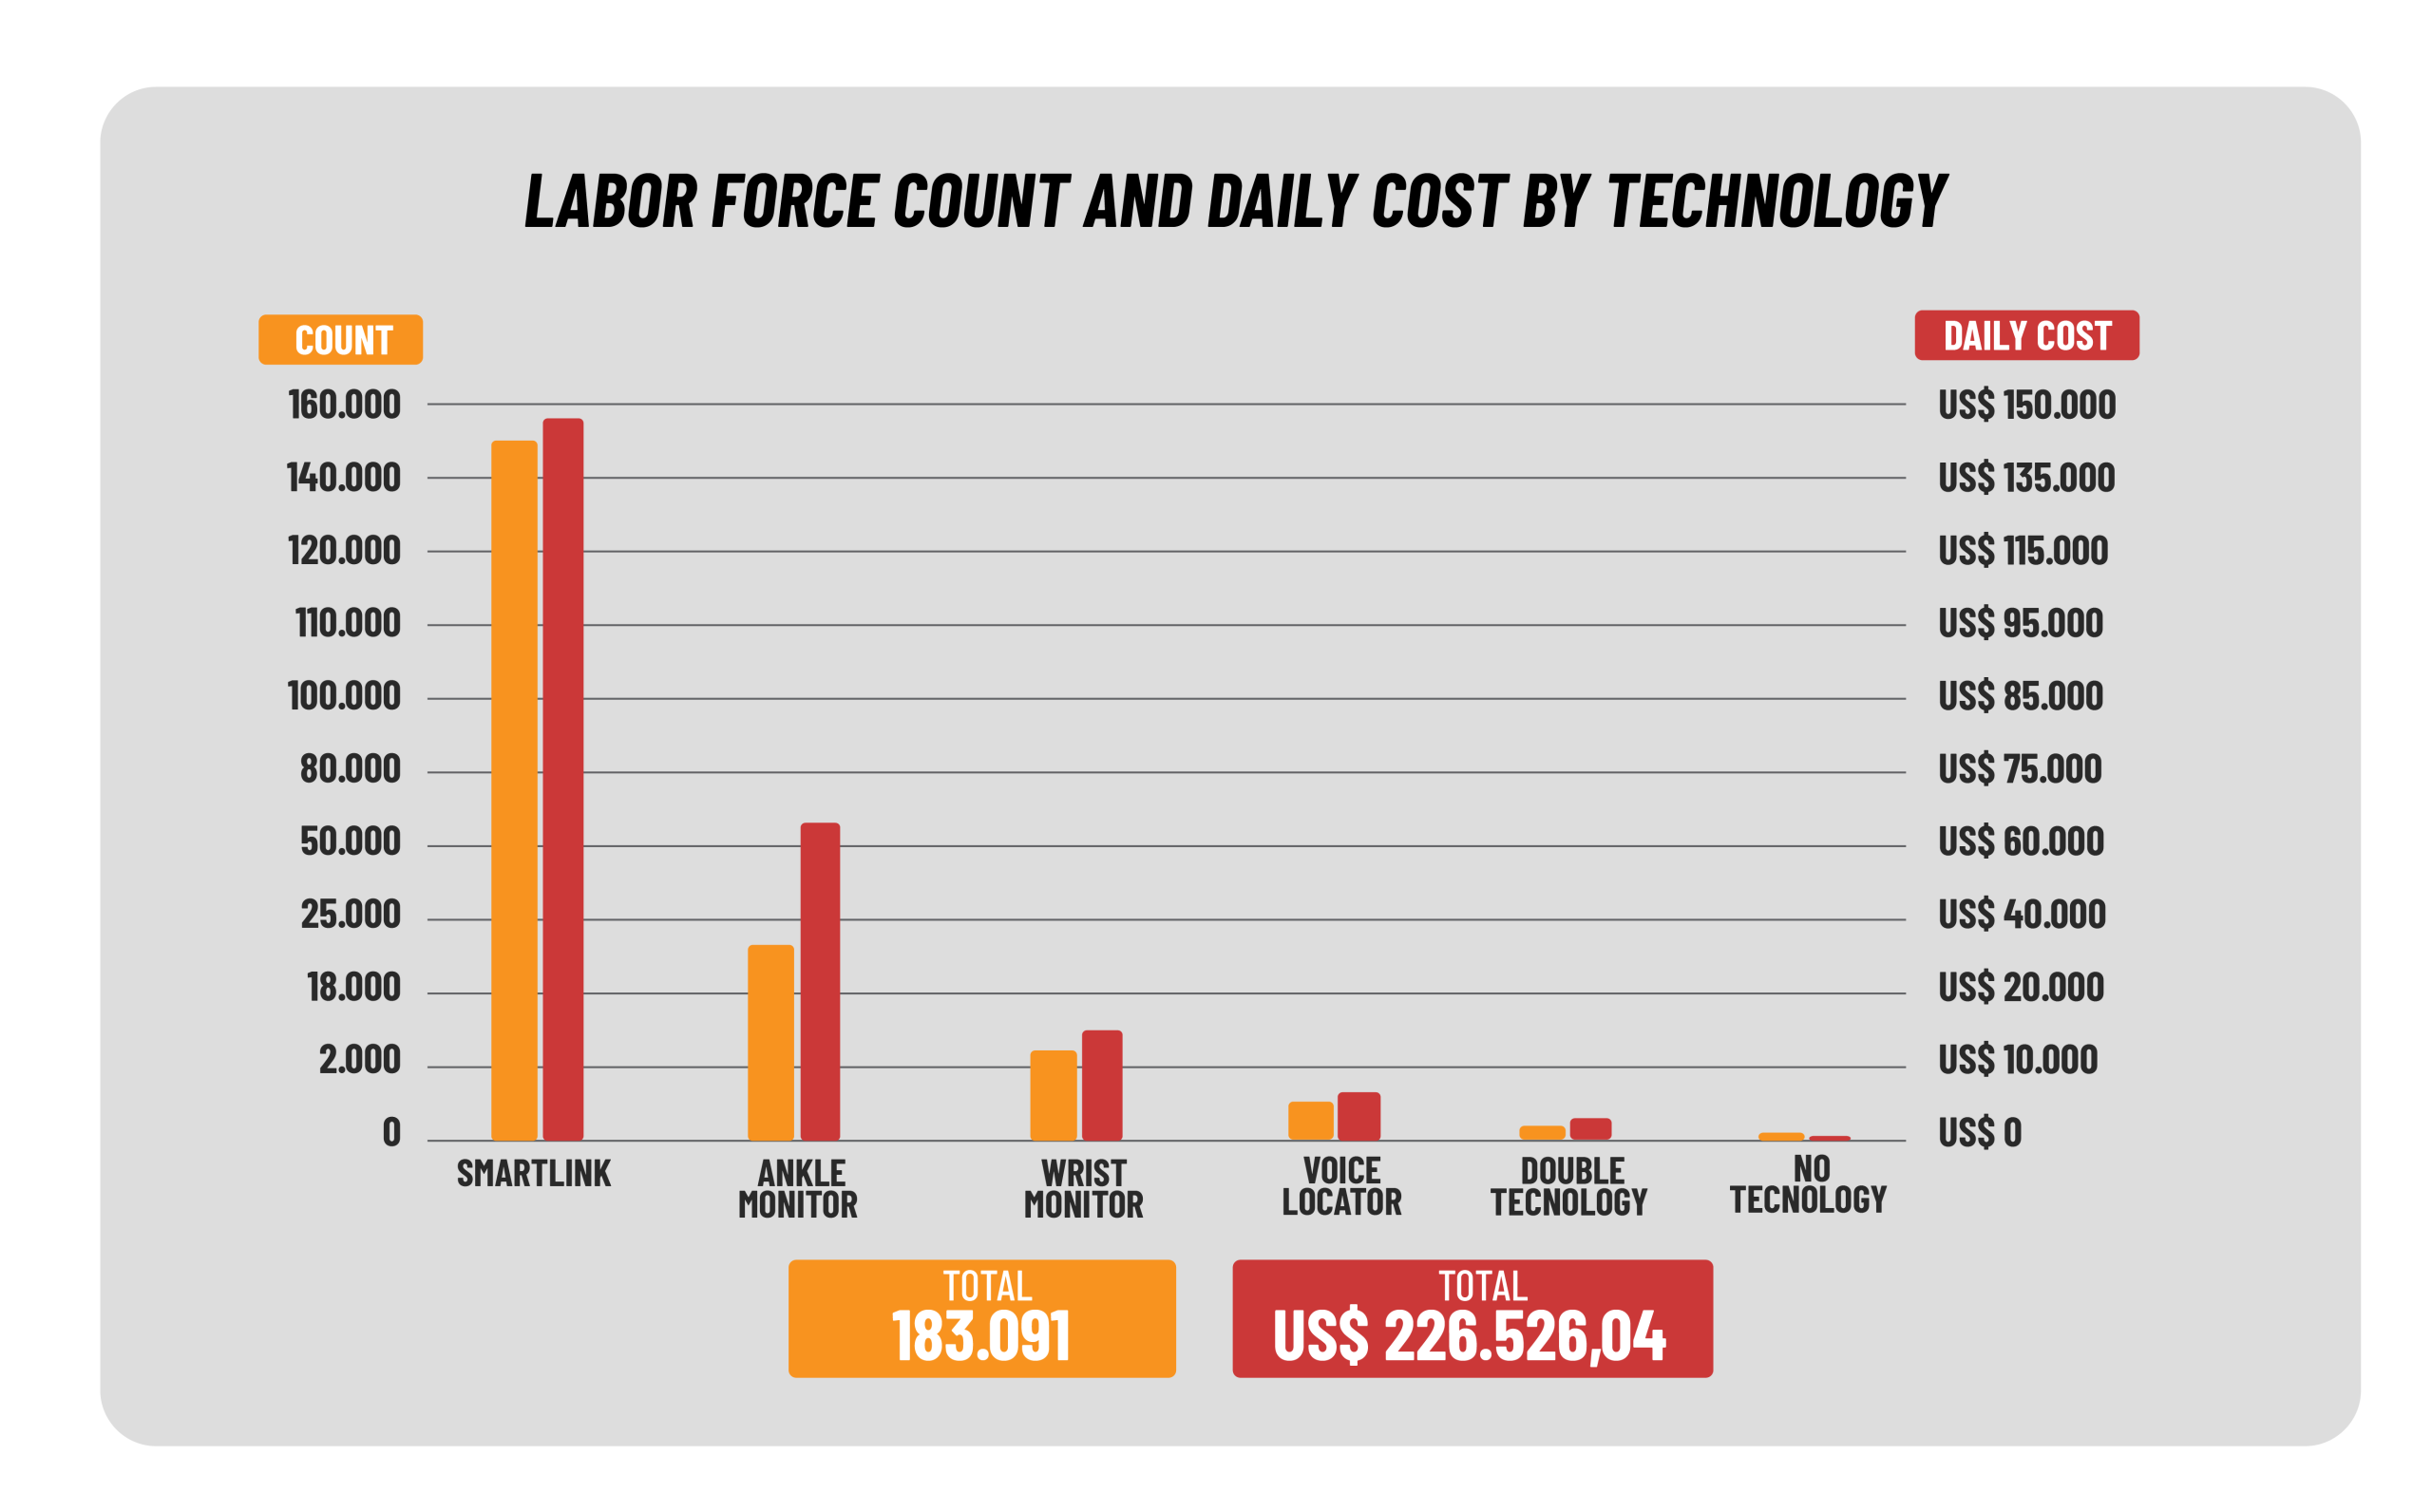
Although some figures differ, the ICE report indicates that, as of June 29, the agency maintained a total of 183,091 people actively under ATD monitoring and surveillance, with a total daily cost of $226,526.04.
Of these, 155,675 people were under SmartLink, 23,338 with ankle or wrist monitors, and 2,861 respectively, and 1,204 with voice identification. The average duration in the program is close to 700 days, that is, almost two years.
Annex 3. Active population count and daily cost by technology
What trend do the ankle monitor usage figures show?
An analysis of the use of ankle monitor technology during the first 6 months of the Trump government shows that, although there was a slight decline in March, the rest of the months marked a progressive increase in several states and cities.
For example, while in February there were around 17,827 immigrants with ankle monitors in 18 states, representing 9.61% of the total ATD population, by July this figure had risen to 13.4%, with 24,566 people. Although the official rhetoric centers on mass deportations, the data reflect that the use of ATD (Alternatives to Detention), with a new emphasis on electronic shackles, remains active and increasing, with variations depending on city or state.
Washington D.C. with a growth of 491% and states such as Massachusetts with 129%, New Jersey with 116%, Utah with 115%, and Colorado with 95% have driven the growth of the ankle monitor population from February to July 2025.
The case of Texas deserves further attention. Although Houston and El Paso showed increases between February and July 2025, with rises of 82% and 24% respectively, other cities such as Dallas (-14%), San Antonio (-29%), and Harlingen (-51%) presented significant decreases. This indicates that, although the overall percentage could have been much lower, Houston and El Paso created an atypical situation. Despite this, Texas is the state with the least growth in this type of surveillance, at just 2.67%.
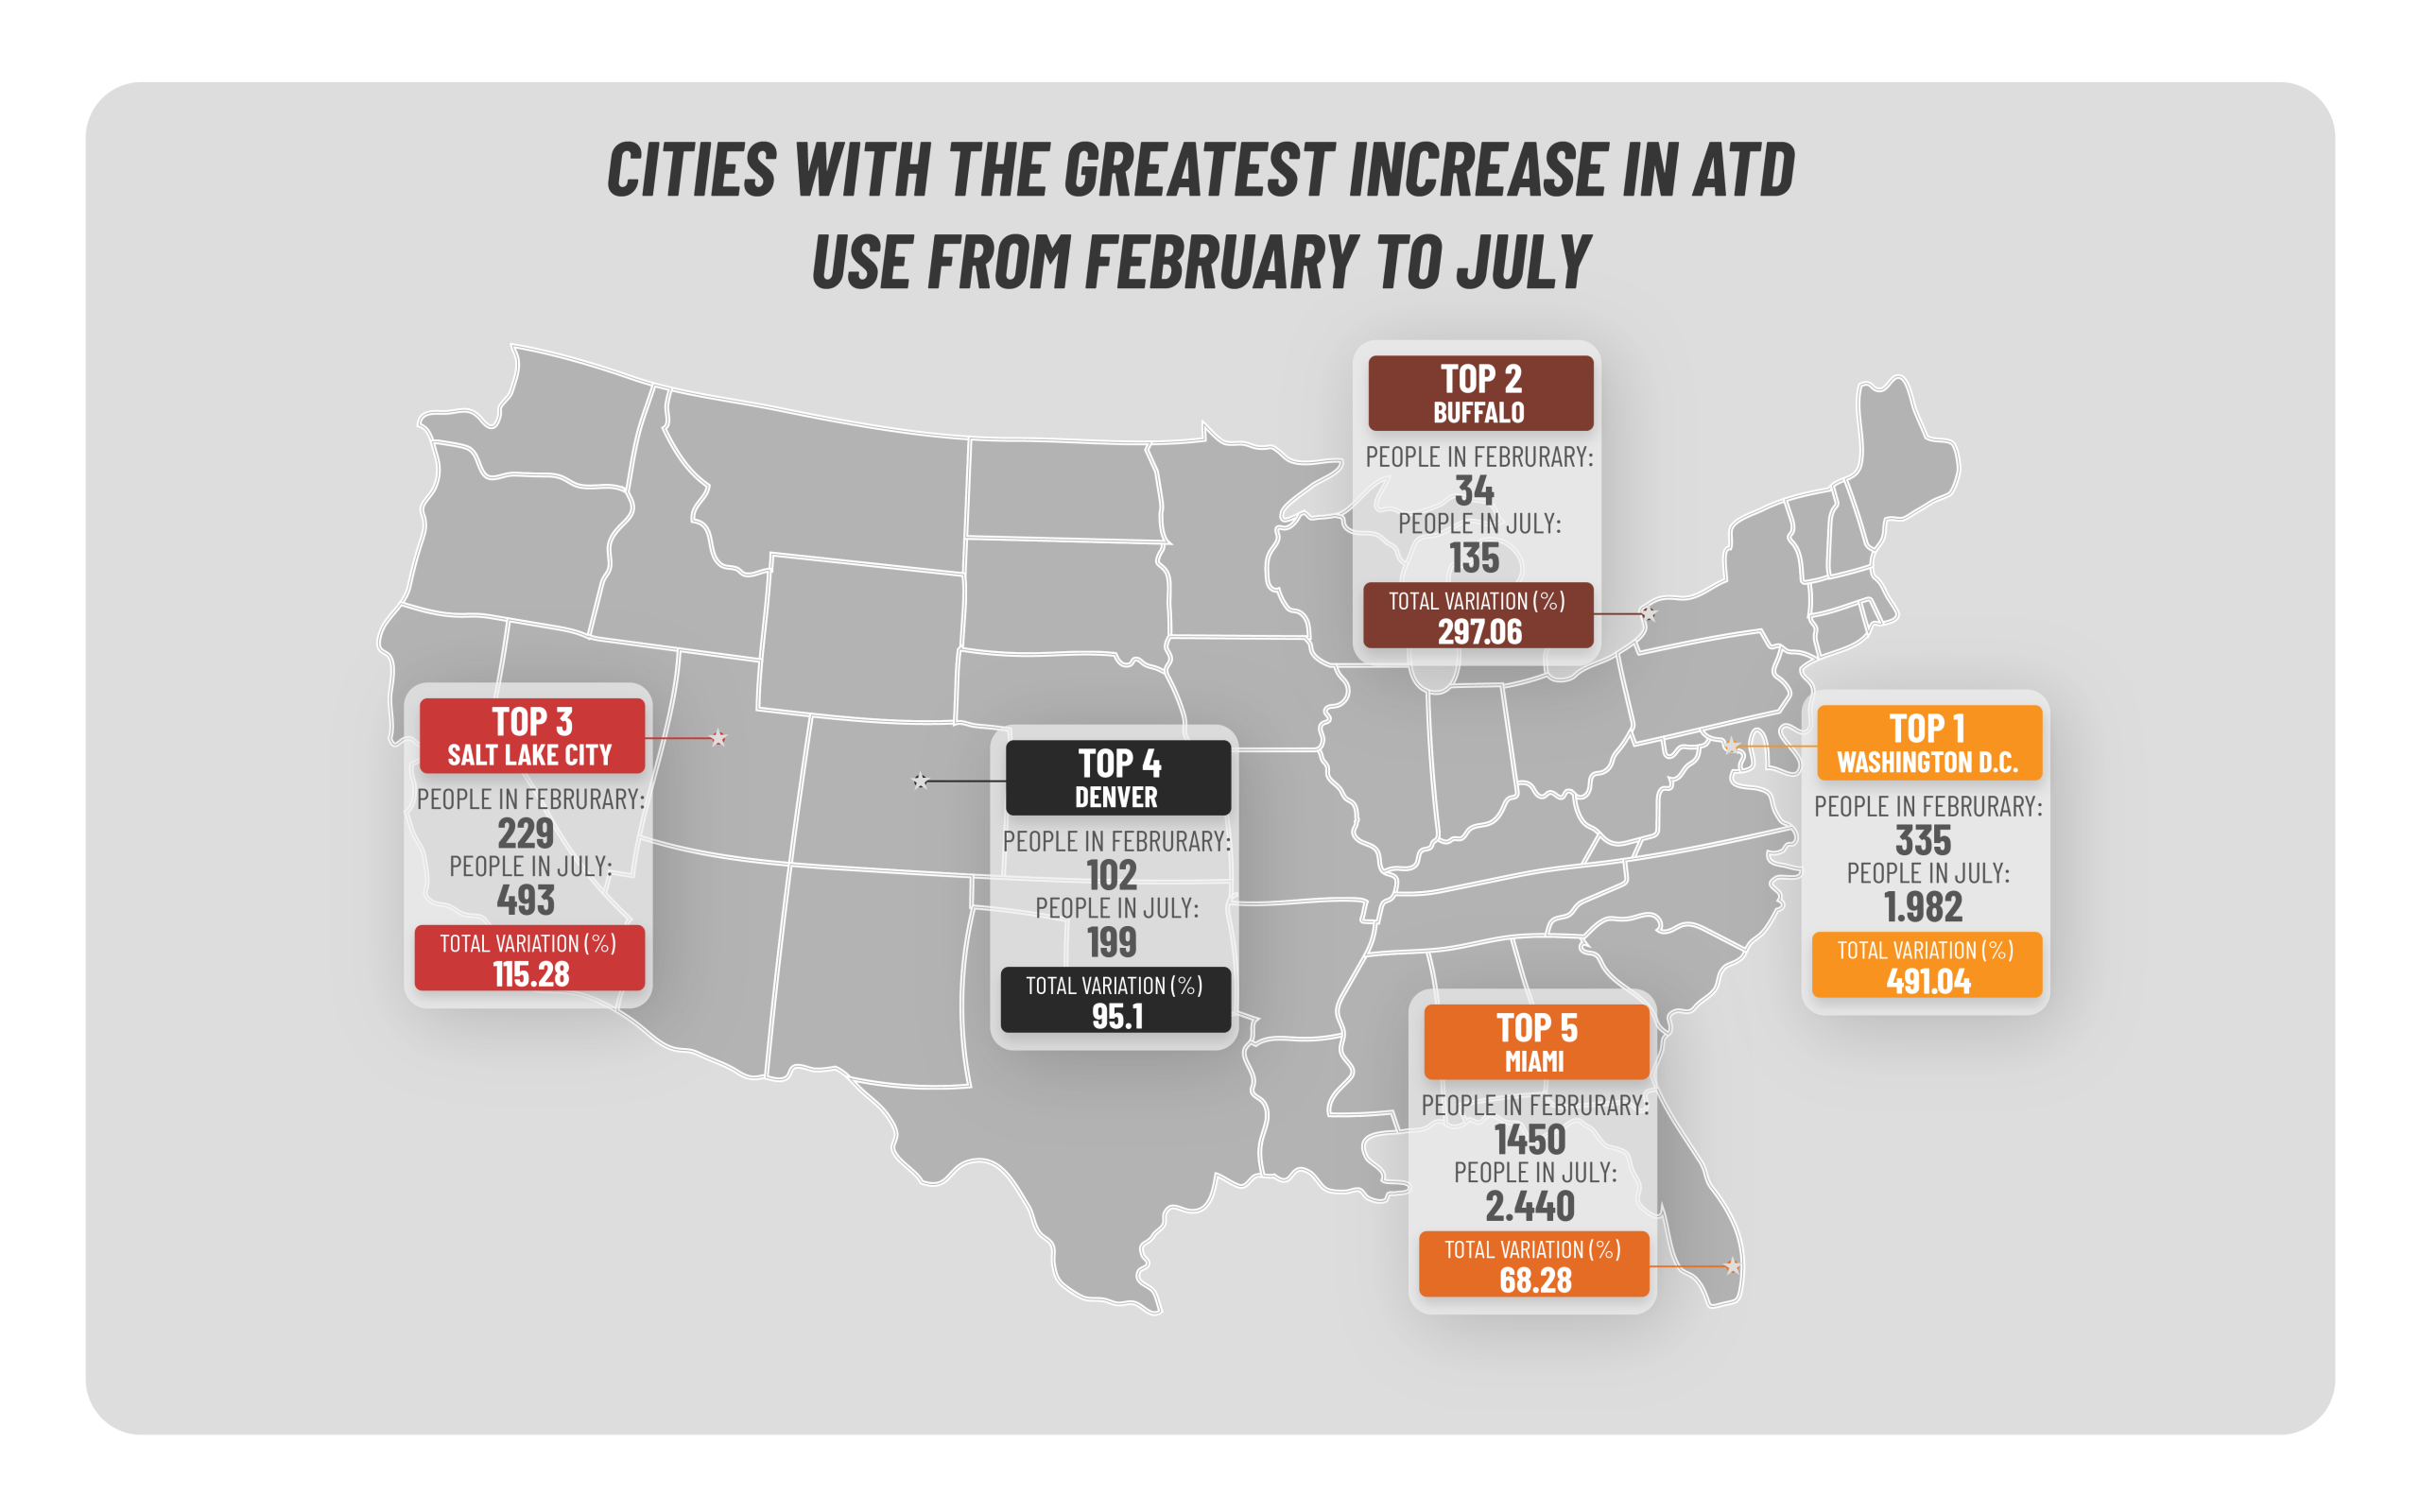
The regional pattern also reveals differences: while cities such as Washington D.C. (+491%), Buffalo (+297%), Boston (+129%), Newark (+116%), Salt Lake City (+115%), Denver (+95%), and Houston (+81%) had sharp increases in the number of people with shackles, Miami (+68%), New Orleans (+61%), Baltimore (+53%), Atlanta (+40%), Detroit (+39%), New York (+34%), San Francisco (+32%), Phoenix (+25%), El Paso (+24%), Philadelphia (+22%), and Los Angeles (+21%) showed milder rises in the number of people with this technology.
Washington D.C., for example, increased its monitored immigrant population from 335 people in February to 1,982 in July. A similar case occurred in Miami, which went from 1,450 people in February 2025* to 2,440 in July.
Annex 4. Cities with the greatest increase in ATD use from February to July
Which cities drove the month-to-month increases?
In the exhaustive study we conducted on the implementation of this technology in 18 states including the U.S. capital, we found that all territories increased the population with ankle monitors between February and July.
However, some specific cities pulled the numbers up in certain months. From February to March, one of the most significant was Denver, which had an 80% variation going from 102 to 184 people, followed by Newark, which added 39% going from 442 to 617 people with this technology. In contrast, during that period cities such as San Antonio (-42%), Harlingen (-37%), and El Paso (-25%) decreased the number of people using this technology.
Cities with greatest ATD use increase from February to March
| City | Variation (%) | People January | People July |
| Denver | 80.39 | 102 | 184 |
| Newark | 39.59 | 442 | 617 |
| San Antonio | -41.19 | 1,396 | 821 |
| Harlingen | -36.95 | 812 | 512 |
| El Paso | -24.63 | 674 | 508 |
From March to April, the upward pace was led by Houston with a 31.3% increase, Boston 28.5%, New Orleans 23.2%, Salt Lake City 17%, and Baltimore 16%.
Cities with greatest ATD use increase from March to April
| City | Variation (%) | People January | People July |
| Houston | 31.35 | 520 | 683 |
| Boston | 28.55 | 725 | 932 |
| Nueva Orleans | 23.28 | 812 | 1,001 |
| Ciudad del Lago | 17.41 | 224 | 263 |
| Baltimore | 16.84 | 196 | 229 |
For April to May, the cities with the greatest percentage increase in ankle monitor use were: Buffalo with 159% (32 → 83), Washington D.C. with 100% (397 → 795), El Paso with 42% (508 → 722), and Houston and Salt Lake City with 23%.
Cities with greatest ATD use increase from April to May
| City | Variation (%) | People April | People May |
| Buffalo | 159.38 | 32 | 83 |
| Washington D.C. | 100 | 397 | 795 |
| El Paso | 42.13 | 508 | 722 |
| Houston | 23.43 | 683 | 843 |
| Ciudad del Lago | 23.57 | 263 | 325 |
From May to June, the increase was led by Washington D.C. with 52.4% (795 → 1,212), followed by Buffalo with 32%, Salt Lake City with 12%, El Paso with 10%, and Boston with 5%.
Cities with greatest ATD use increase from May to June
| City | Variation (%) | People May | People June |
| Washington D.C. | 52.45 | 795 | 1,212 |
| Buffalo | 32.53 | 83 | 110 |
| Ciudad del Lago | 12.31 | 325 | 365 |
| El Paso | 10.11 | 722 | 795 |
| Boston | 5 | 1,199 | 1,259 |
From June to July, the rate of increases was again led by Washington D.C. with 63.5% (1,212 → 1,982), followed by Salt Lake City 35%, San Antonio 32%, Buffalo 22%, and Miami 16%.
Cities with greatest ATD use increase from June to July
| City | Variation (%) | People June | People July |
| Washington D.C. | 63.53 | 1,212 | 1,982 |
| Ciudad del Lago | 35.07 | 365 | 493 |
| San Antonio | 32.23 | 754 | 997 |
| Búfalo | 22.73 | 110 | 135 |
| Miami | 16.25 | 2,099 | 2,440 |
Cities with negative or low increases
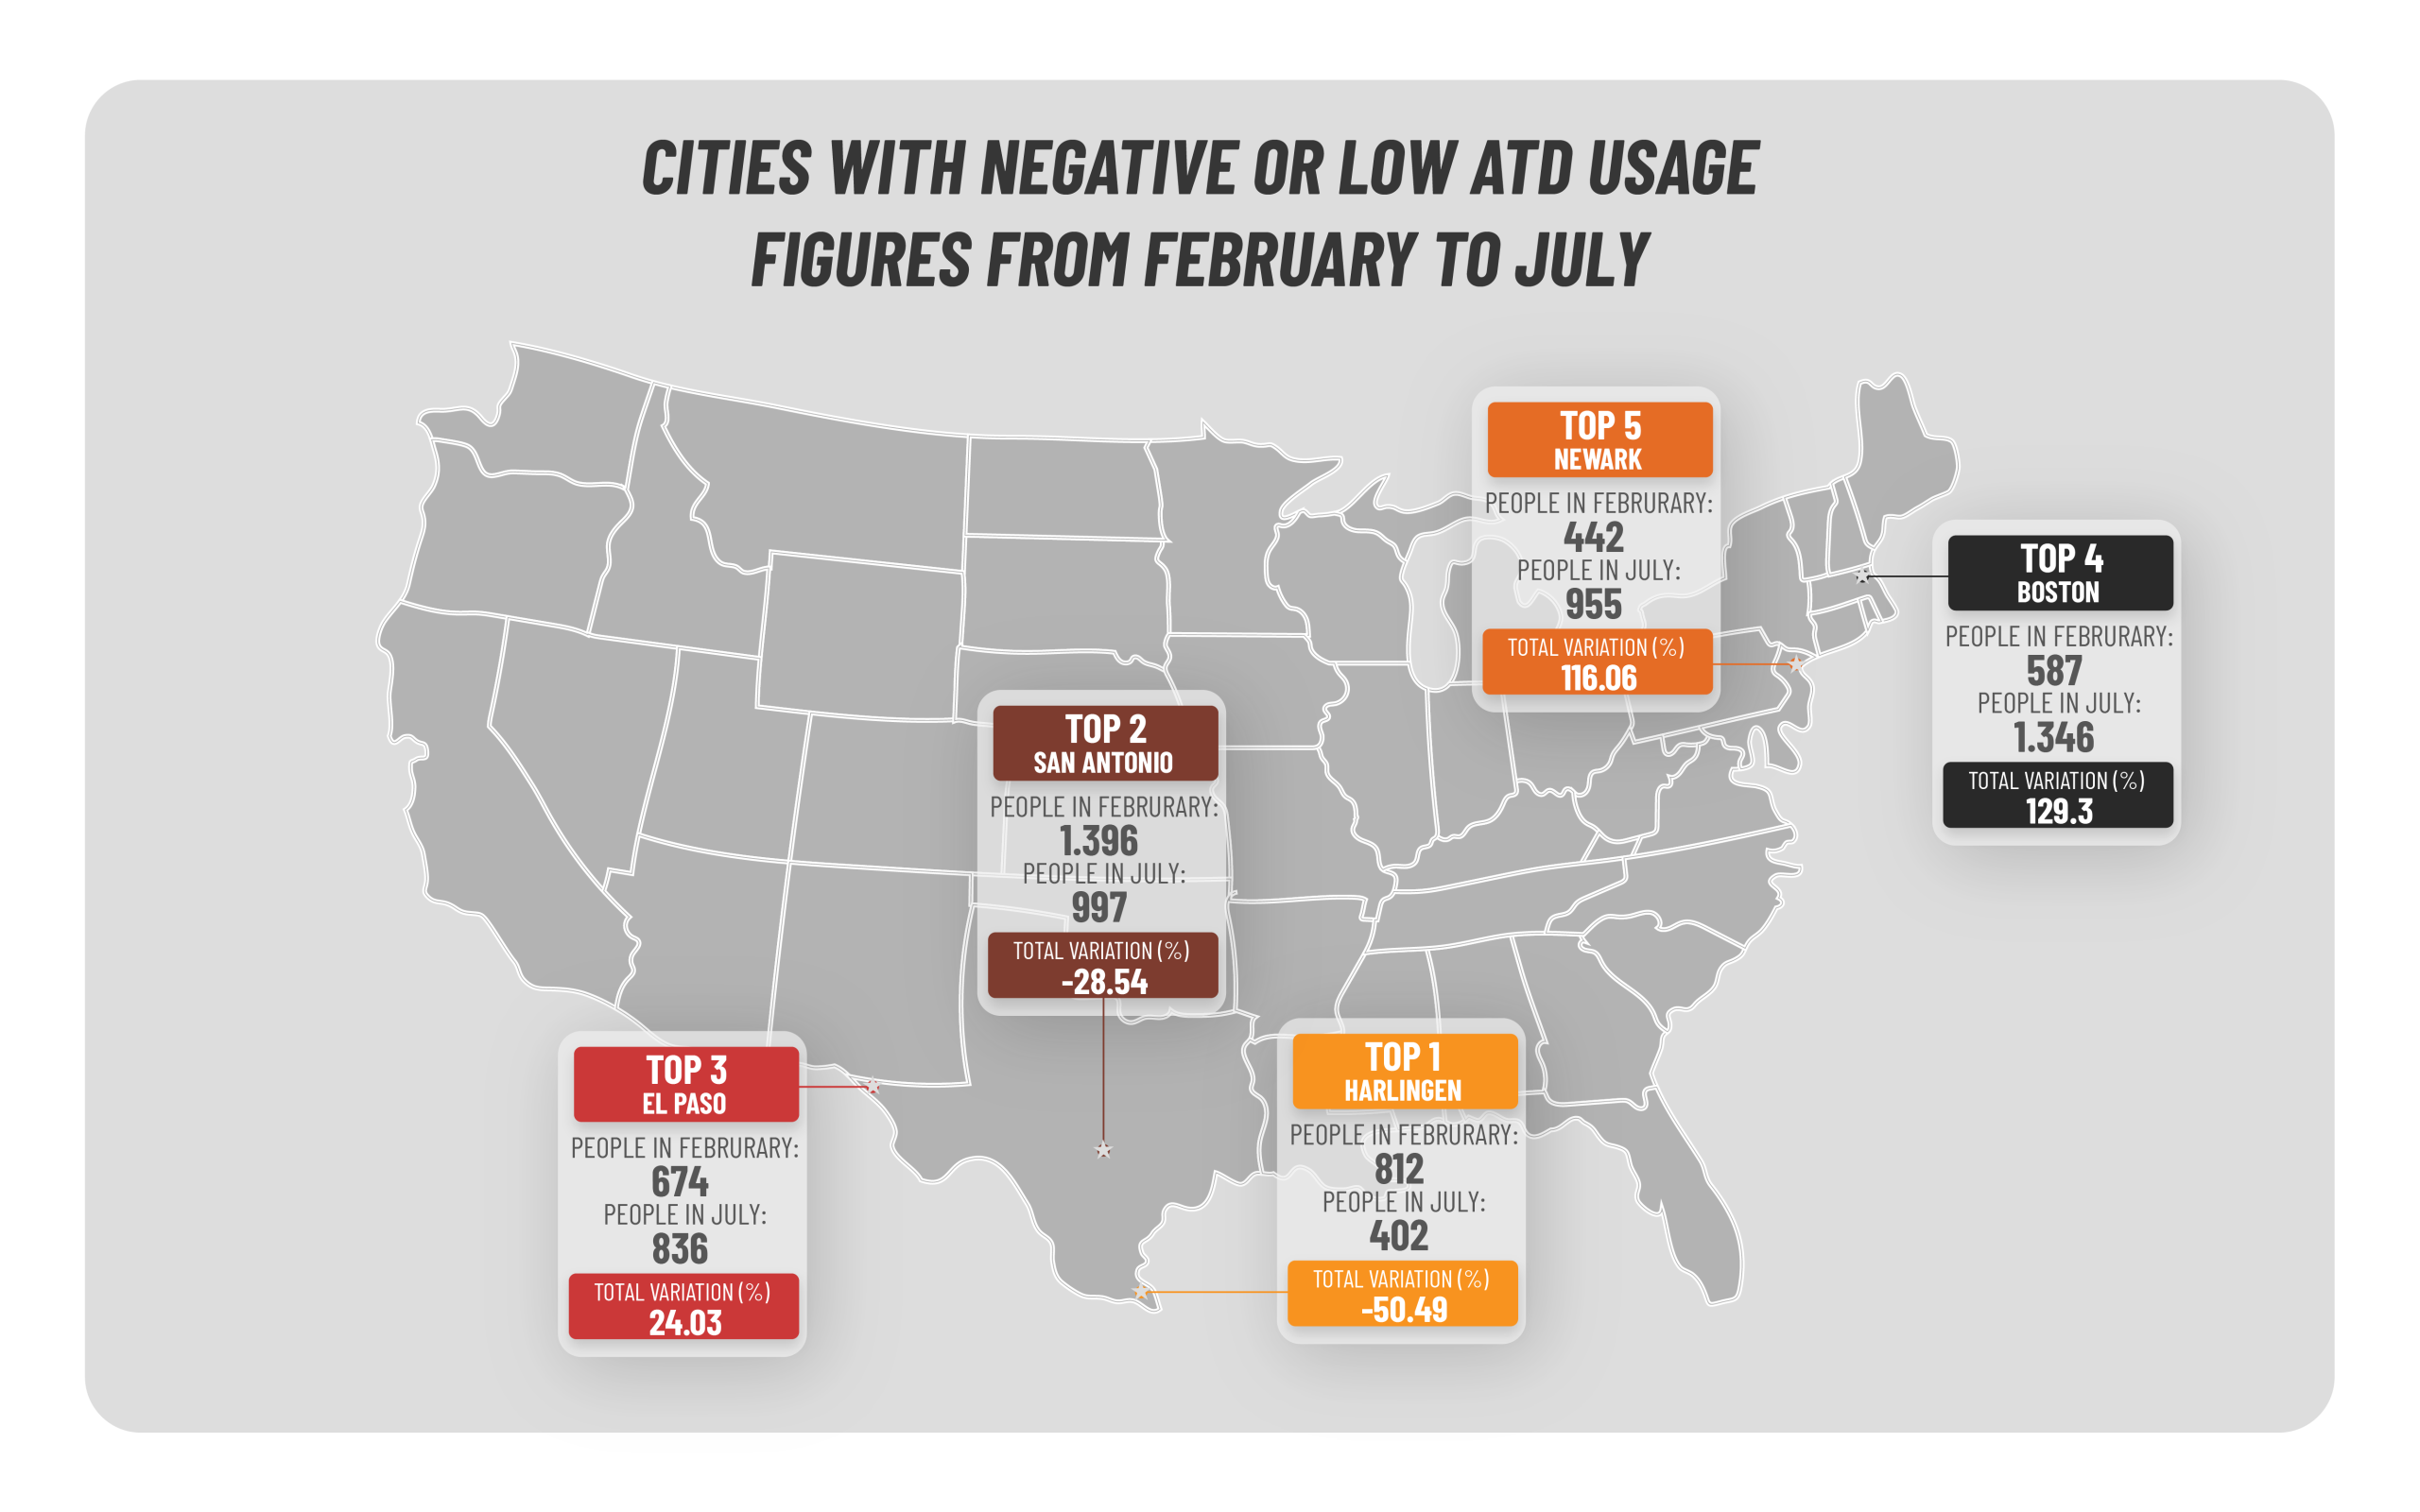
On the other hand, other cities decreased or had low increases in the population monitored with shackles. The most significant reduction was in Harlingen, which went from 812 people in February to 402 in July, a drop of –50.4%. San Antonio also fell, from 1,396 in February to 997 in July (–28.5%).
Among the cities with lower increases, El Paso stands out, which from February to July went from 674 to 836 people with ankle monitors, just a 24% increase. Boston and Newark also showed little variation.
Annex 6. Cities with negative or low ATD use from February to July
How do non-sanctuary states-cities perform?
12 states that are not considered sanctuaries saw increases in the undocumented immigrant population under this type of surveillance. These include Georgia, Maryland, Massachusetts, Michigan, Florida, Louisiana, New Jersey, Pennsylvania, Arizona, Utah, Minnesota, and Washington D.C.
The largest increases were:
- Washington D.C.: 335 in February → 1,982 in July (+491%)
- New Jersey: 442 → 955 (+116%)
- Florida: 1,450 → 2,440 (+68.3%)
- Louisiana: 793 → 1,277 (+61%)
- Massachusetts: 587 → 1,346 (+29.3%)
Washington D.C. is a particular case, since in 6 months it went from 5% growth (335 people) to 491% in July (1,982 people). Florida is also striking, as its authorities have pushed and supported a race for mass deportation of immigrants, to the point that they have already announced the construction of a second detention center.
Why does the Trump government want to implement ankle monitors for the entire ATD population?
An internal ICE memorandum instructed staff to place electronic ankle monitors on all individuals enrolled in the Alternatives to Detention (ATD) program of the agency “whenever possible.”
According to the notice, the changes in the immigrant monitoring system for those not held in detention centers were to be implemented starting in July, with the aim of tracking those enrolled in the program. This update raises important questions about privacy, freedom, and the daily lives of those under surveillance. It also leaves serious concerns because it is not clear whether there will be a change in technology for those already in the program, whether this would be mandatory or voluntary, or if it would only apply to those entering ATD for the first time.
(https://immigrationforum.org/article/legislative-bulletin-thurday-july-31-2025/)
Currently, only 13% of those in ATD use this ankle technology. ICE states in its memorandum that “if the foreign national is not being arrested at the time of check-in, elevate their level of supervision to GPS ankle monitors and thus increase reporting requirements.” According to the American Immigration Council, 83% of non-detained immigrants attended all their hearings between 2008 and 2019.
(https://www.americanimmigrationcouncil.org/fact-sheet/immigrants-and-families-appear-court/)
Of the 183,000 adult immigrants enrolled in the program (*as of July), 84% are monitored through the SmartLINK mobile application, which provides virtual reports on identity and location.
This is what ICE said
Emily Covington, ICE spokesperson, stated that the agency is using electronic shackles as a “control tool” to ensure compliance with federal law. She further argued that “greater accountability should not come as a surprise” and that ICE still makes decisions based on each individual case, with officials retaining discretion to decide which immigrants must wear shackles.
Need or Business?
According to the organization The Flaw, ATDs have also become another way for corporations to profit from immigrants through contracts for electronic monitoring.
(https://theflaw.org/articles/migrant-bodies-as-commodities/)
This program is managed mainly by BI Incorporated, a subsidiary of the private prison company Geo Group. For this reason, it is very likely that the requested increase in the number of ankle monitoring devices will generate even more business for Geo Group, a private prison organization headquartered in Florida.
Geo Group is one of ICE’s largest contractors and under the Trump administration has benefited from the expansion of its operations thanks to the administration’s immigration policies. ICE has signed contracts with Geo for the reopening of some detention centers and deportation flights through its airline.
(https://sam.gov/workspace/contract/opp/04775bc56efe47a9be9a82e19efb812f/view)
Using ankle monitors for the entire population currently under ATD surveillance, as is apparently being proposed, would raise costs to $501,668.39. In other words, it would increase monitoring costs by more than 50% compared to what is currently paid daily for the use of various technologies ($226,526.04).
How much do these devices affect people?
Immigrant rights advocates have expressed concern about the widespread use of electronic ankle monitors, which are socially stigmatizing.
A study conducted by the Immigrant Defense Project in 2021 revealed that the consequences of ICE’s use of electronic shackles went far beyond simple monitoring. According to a survey of people subjected to these devices, 90% reported experiencing physical pain, numbness, swelling, or even electric shocks.
In addition, 88% reported negative impacts on their mental health and 12% said they had experienced suicidal thoughts. Almost all respondents reported having suffered social isolation due to the stigma associated with the shackle. Sixty-seven percent reported economic difficulties for themselves and their families, in part due to barriers to accessing employment.
For its part, the organization Detention Watch Network (DWN), which advocates for ending immigrant detention and deportation and promotes more humane immigration policies, has warned that so-called Alternatives to Detention (ATD), far from being benevolent solutions, can cause serious physical and psychological trauma.